Submit an Article
Navigate
Home
Editorial Board
Editorial Policies
Current Volume
Archive
Scientific Integrity
Publication Ethics Statements
Interviews with Outstanding Authors
Newsroom
Sponsored Conferences
Podcast
Contact
Special Collections
Submit an Article
Online ISSN: 1945-4589
Research Paper
|
Volume 15, Issue 8
|
pp. 2906–2919
Whole-transcriptome sequencing analysis reveal mechanisms of Yiqi Huoxue Yangyin (YHY) decoction in ameliorating D-gal-induced cardiac aging
Back to article
Figure 2
(2 of 8)
−
100%
+
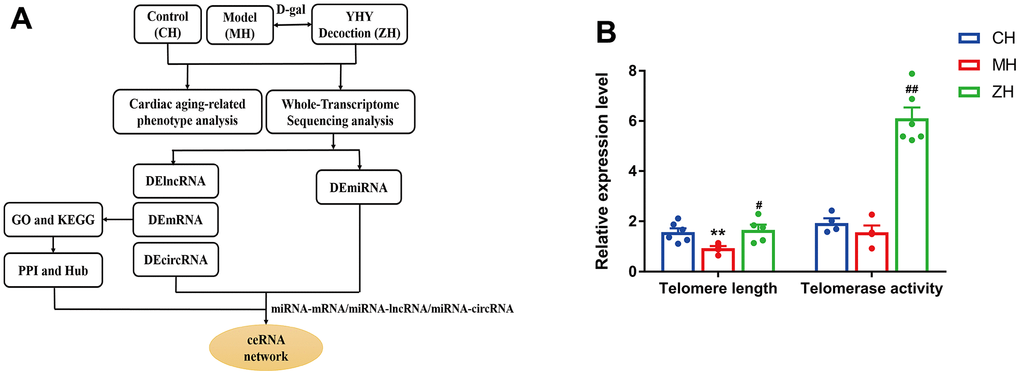
Figure 2.
(
A
) The workflow of the study design. (
B
) Telomere length and Telomerase activity analysis (n=4-6). Compared with control group, *
P
<0.05, **
P
<0.01; compared with model group,
#
P
<0.05,
##
P
<0.01.
Figure 2 — Whole-transcriptome sequencing analysis reveal mechanisms of Yiqi Huoxue Yangyin (YHY) decoction in ameliorating D-gal-induced cardiac aging | Aging