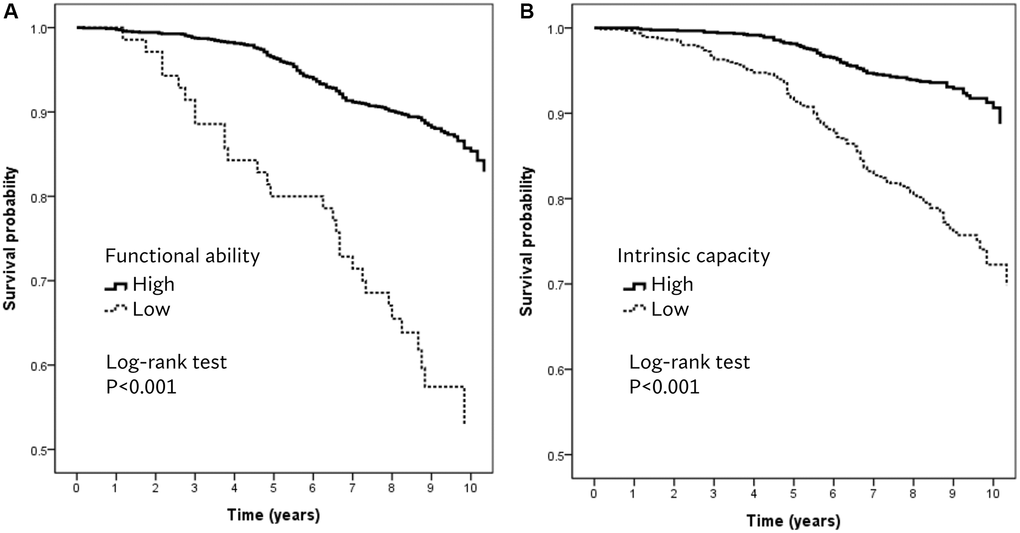
Figure 1.Kaplan–Meier survival plots for (A) functional ability and (B) intrinsic capacity.
Figure 1 — Intrinsic capacity differs from functional ability in predicting 10-year mortality and biological features in healthy aging: results from the I-Lan longitudinal aging study | Aging