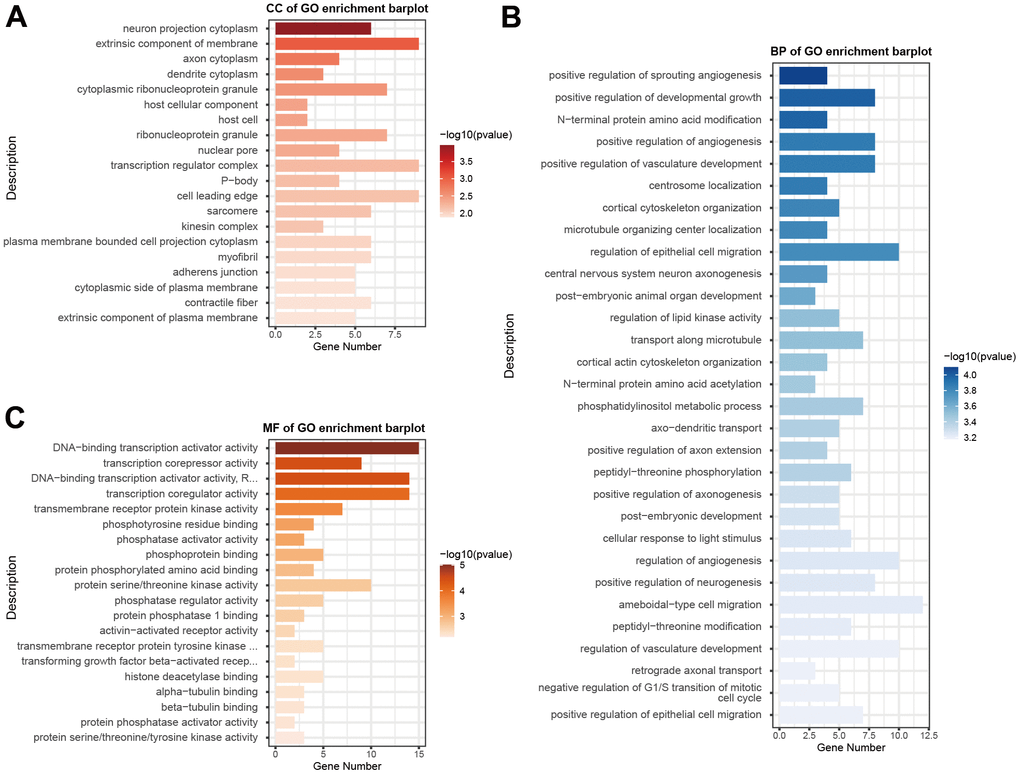
Figure 2.GO functional enrichment analysis of differentially expressed microRNAs. GO enrichment analysis was carried out using CC (A), BP (B), and MF (C). The x-axis shows enriched gene numbers and the color represents significance. GO terms are shown on the y-axis. GO, gene ontology; CC, cellular component; BP, biological process; MF, and molecular function.