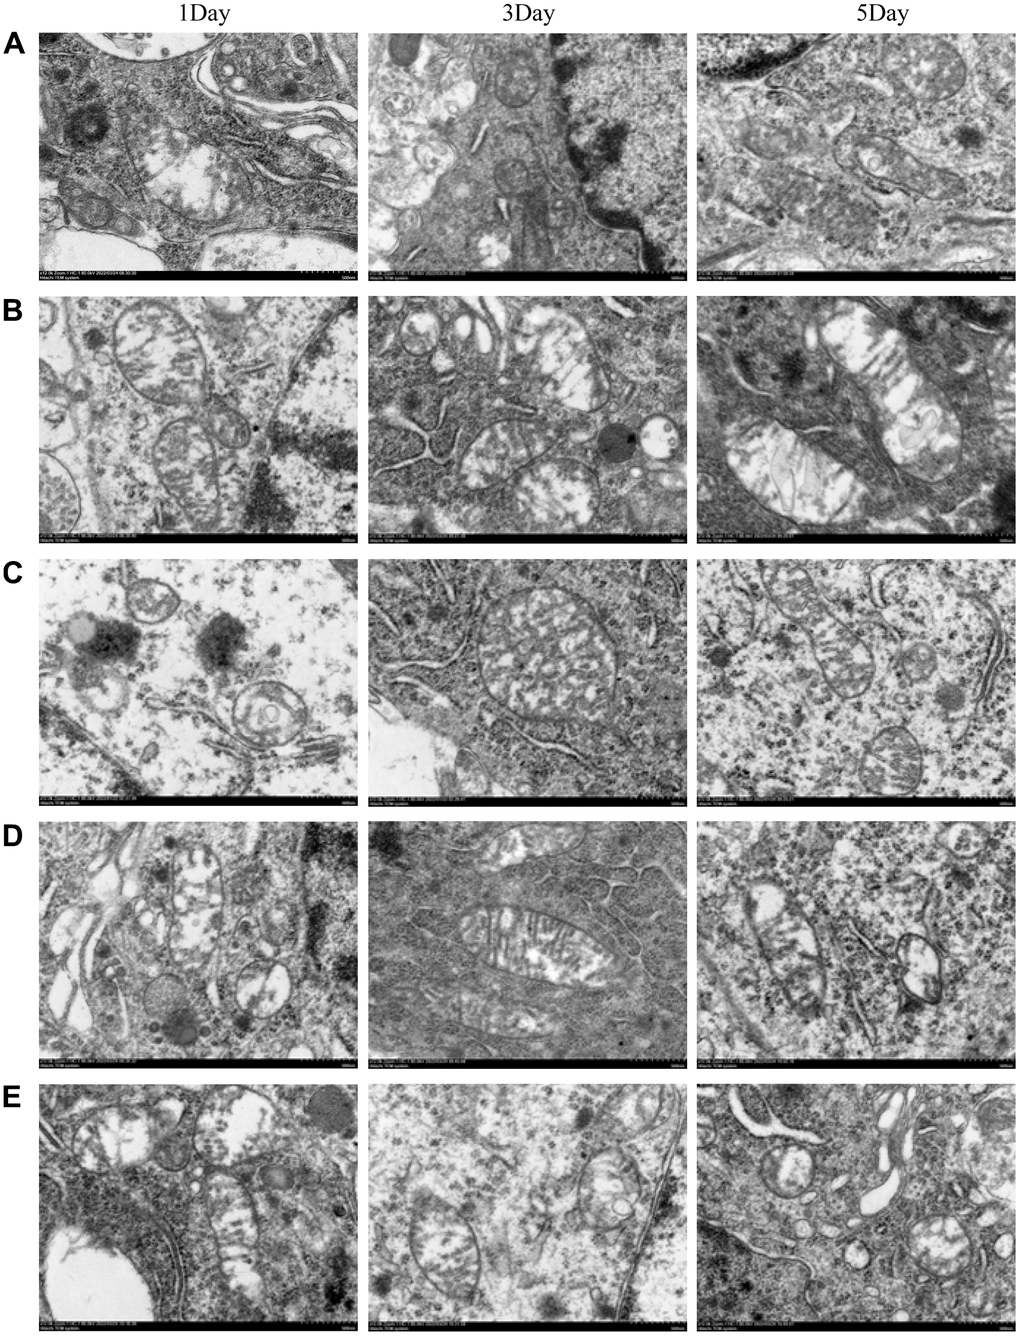
Figure 5.The morphological changes of mitochondria were observed by transmission electron microscopy. (A) blank group, (B) solvent group, (C) NBP group, (D) NBP + agonist group, and (E) NBP + inhibitor group. (Scale bar = 20 μm, magnification = 1200x).