Submit an Article
Navigate
Home
Editorial Board
Editorial Policies
Current Volume
Archive
Scientific Integrity
Publication Ethics Statements
Interviews with Outstanding Authors
Newsroom
Sponsored Conferences
Podcast
Contact
Special Collections
Submit an Article
Online ISSN: 1945-4589
Research Paper
|
Volume 15, Issue 1
|
pp. 276–286
Effects of NBP on postoperative cognitive dysfunction in rats via Nrf 2/ARE pathway
Back to article
Figure 4
(4 of 5)
−
100%
+
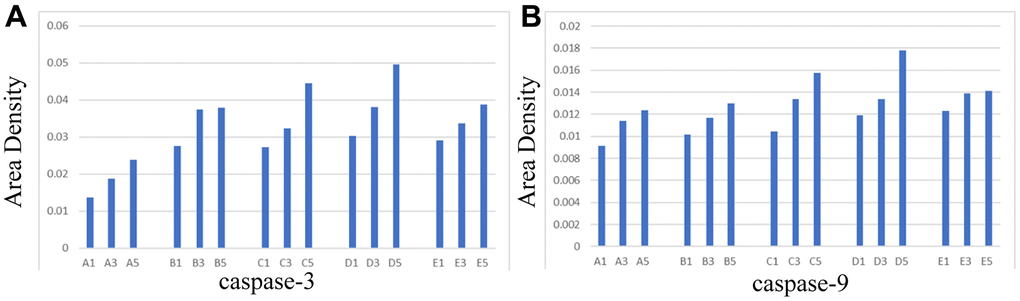
Figure 4.
Area density of hippocampal tissues in each group.
(
A
) caspase-3, (
B
) caspase-9.
Figure 4 — Effects of NBP on postoperative cognitive dysfunction in rats via Nrf 2/ARE pathway | Aging