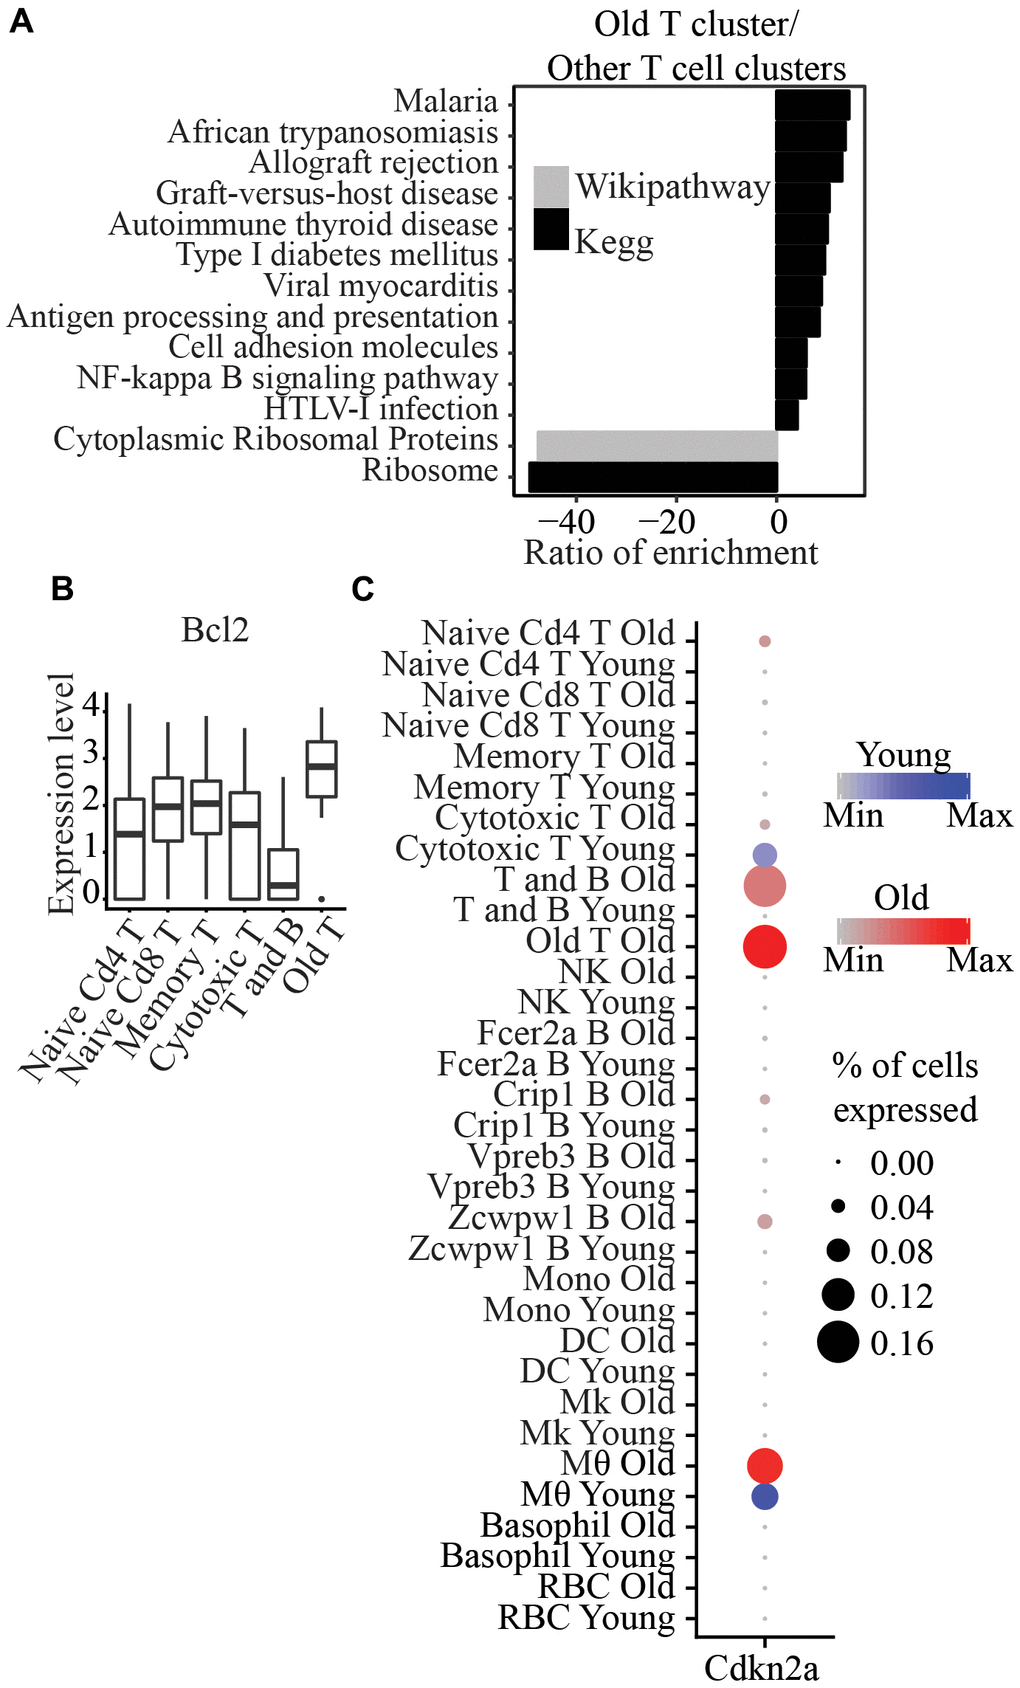
Figure 4.(A) Wikipathway and Kegg pathway analysis of differentially expressed genes between Old T cluster and other T cell clusters. (B) Bcl2 is significantly higher in Old T cluster compared to other T cell clusters. (C) Cdkn2a is significantly higher in Old T cluster compared to all other clusters.