Submit an Article
Navigate
Home
Editorial Board
Editorial Policies
Current Volume
Archive
Scientific Integrity
Publication Ethics Statements
Interviews with Outstanding Authors
Newsroom
Sponsored Conferences
Podcast
Contact
Special Collections
Submit an Article
Online ISSN: 1945-4589
Research Paper
|
Volume 15, Issue 1
|
pp. 6–20
Single-cell transcriptomics of peripheral blood in the aging mouse
Back to article
Figure 2
(2 of 5)
−
100%
+
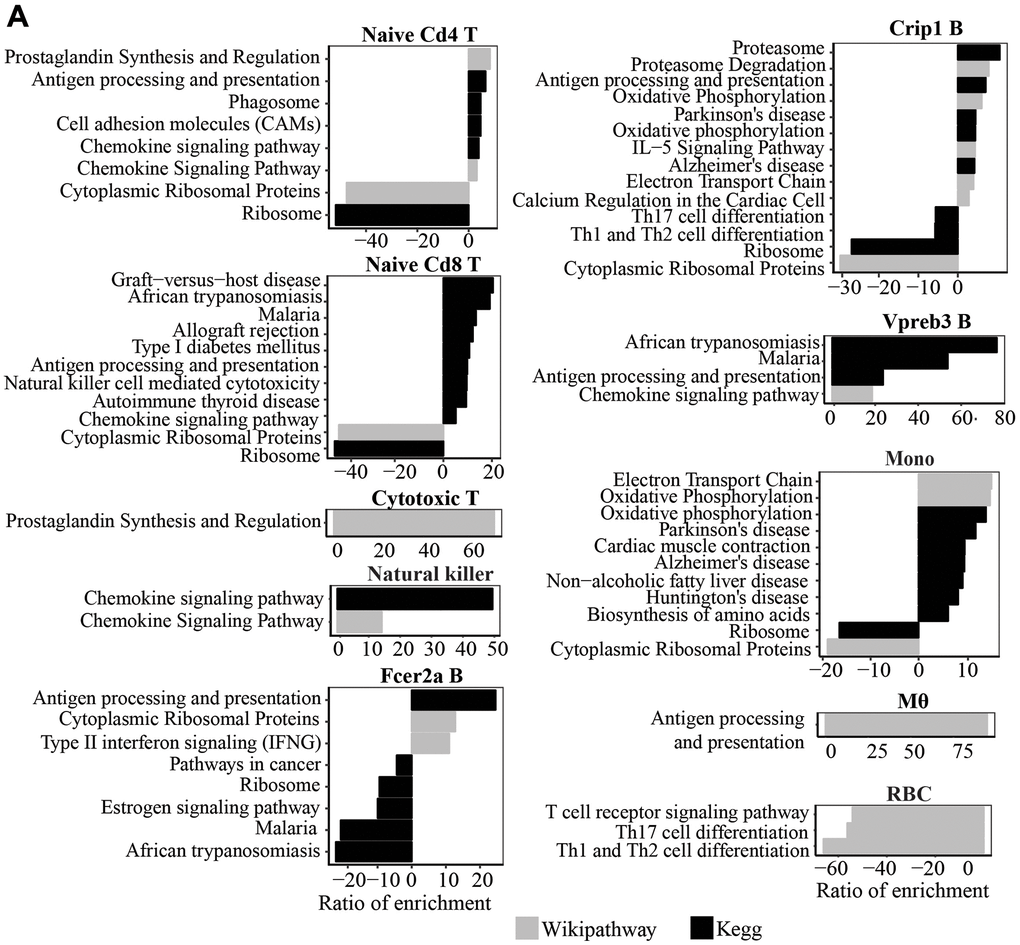
Figure 2.
(
A
) Wikipathway and Kegg pathway analysis of upregulated and downregulated genes in old compared to young mice (P<0.05) in each cluster.