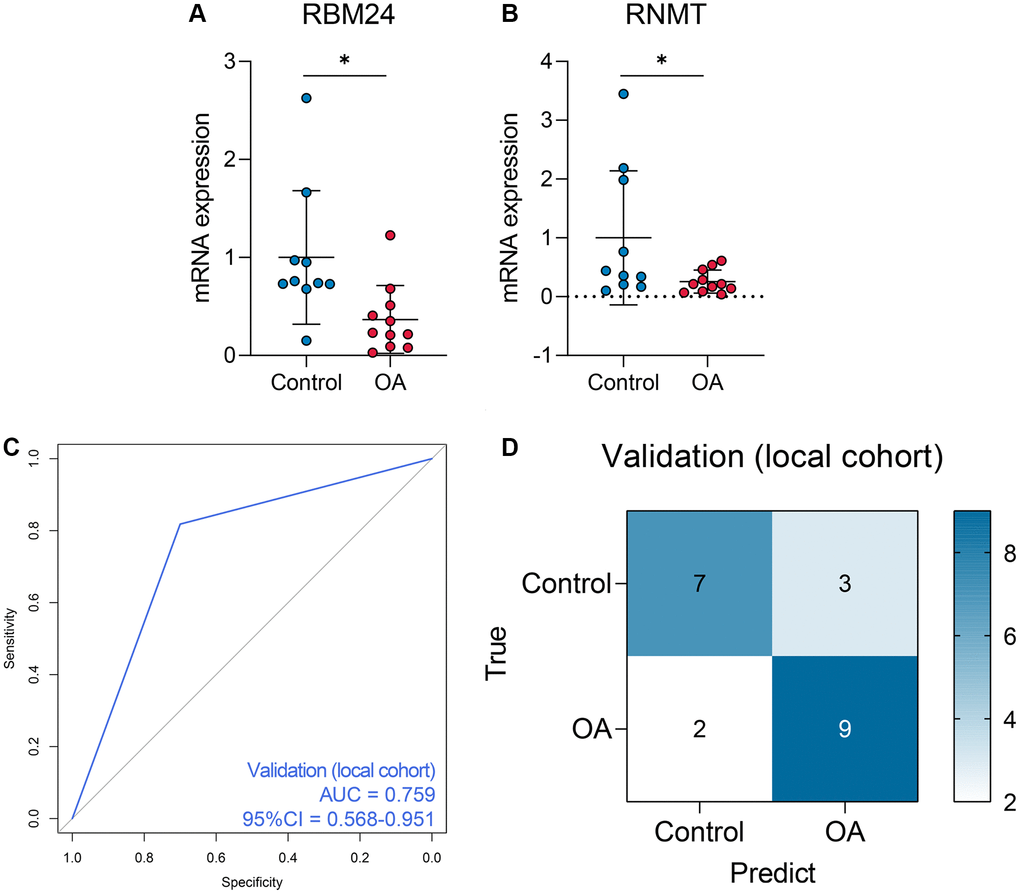
Figure 6.The performance of the random forest model in the local cohort. (A, B) The qPCR experiments indicated that RNMT and RBM24 were both down-regulated in the knee cartilage tissue extracted from OA patients. (C, D) The ROC analysis (C) and the confusion matrix (D) of the random forest model in the local cohort.