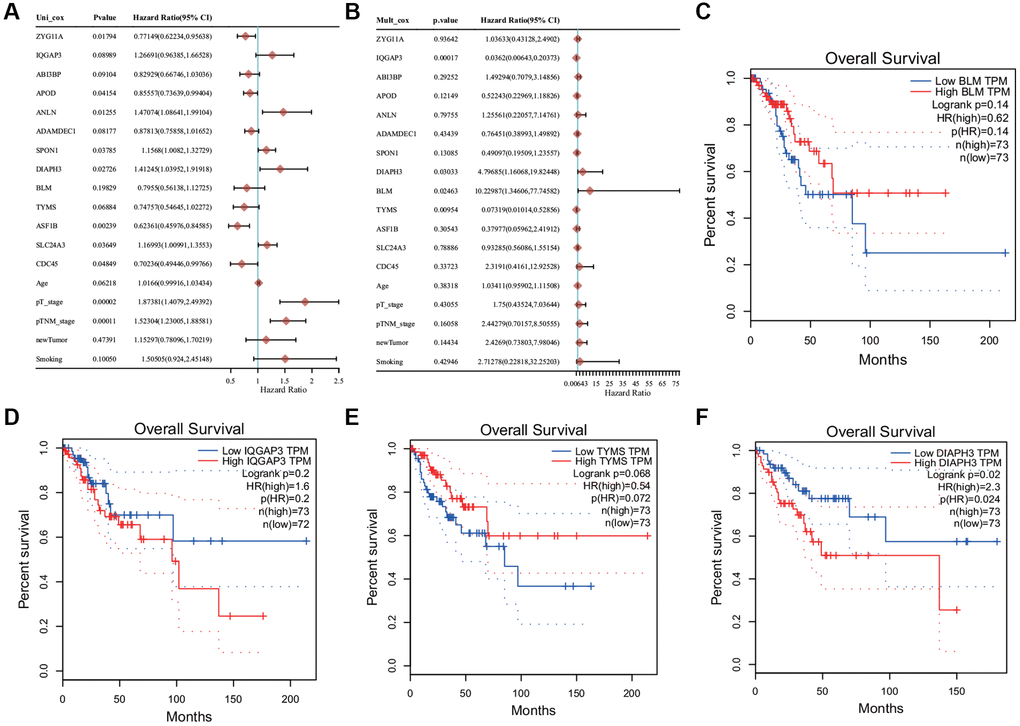
Figure 5.Cox regression analysis and survival analysis. (A) Univariate Cox regression analysis. (B) Multivariate Cox regression analysis. (C) The Kaplan−Meier (KM) survival analysis of BLM. (D) The KM survival analysis of IQ Motif Containing GTPase Activating Protein 3 (IQGAP3). (E) The KM survival analysis of Thymidylate Synthetase (TYMS). (F) KM survival analysis of Diaphanous Related Formin 3 (DIAPH3).