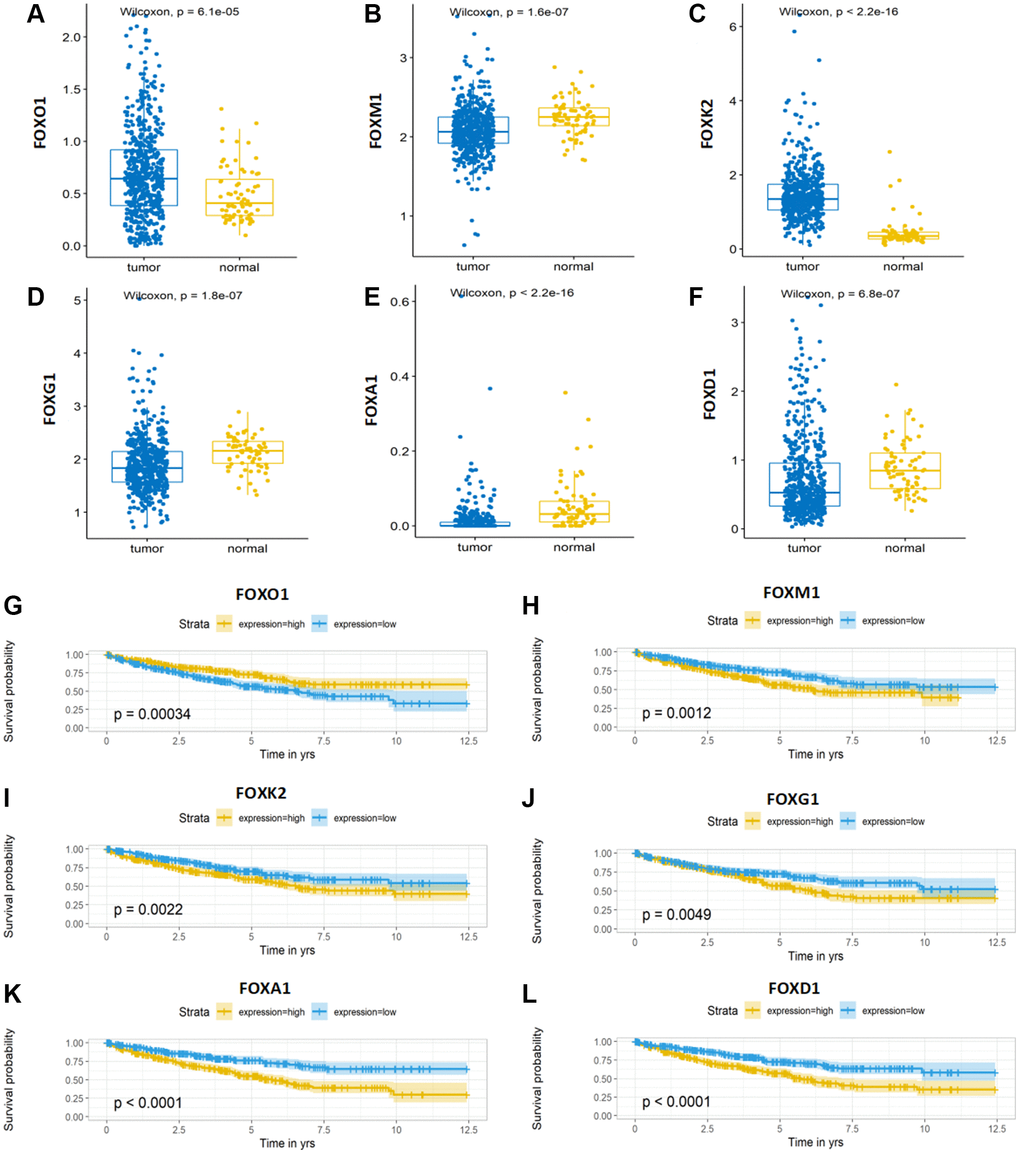
Figure 7.Expression and Kaplan-Meier survival analysis of the six FOX family genes. (A–F) A comparison of the expression levels of FOXO1, FOXM1, FOXK2, FOXG1, FOXA1 and FOXD1 in TCGA KIRC tumor tissue and adjacent normal tissue. (G–L) Kaplan-Meier curves for the six genes in the TCGA KIRC cohort.