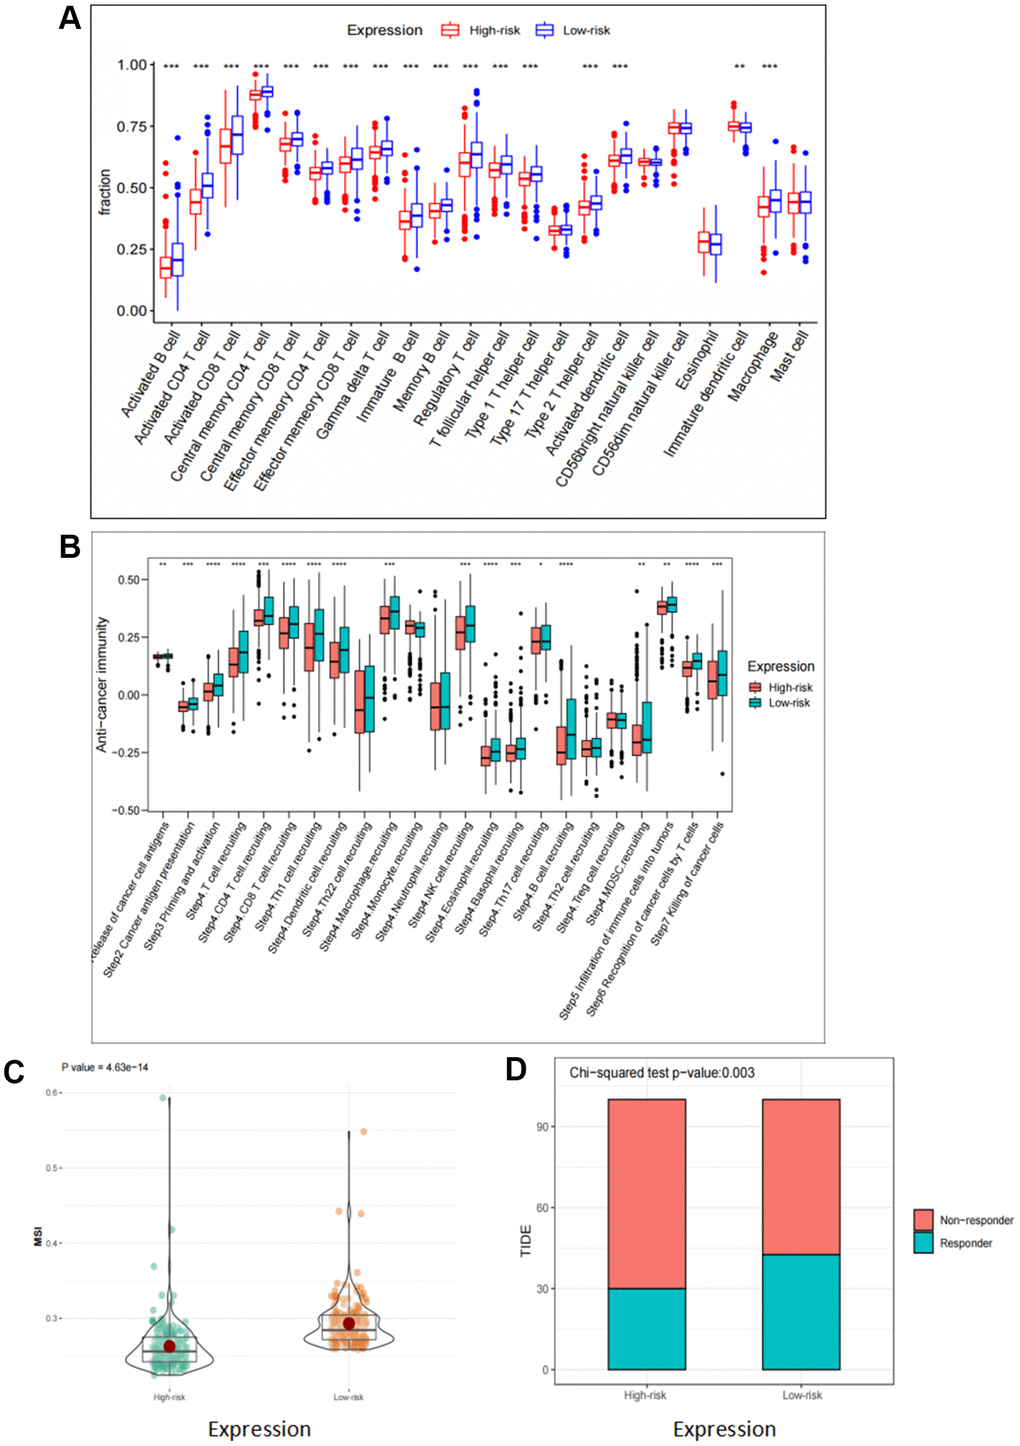
Figure 6.Correlation analyses of risk scores and immune response. (A) Comparison of 22 tumor-infiltrating immune cells in high risk and low risk group. (B) Differences in anti-cancer immunity cycle between high risk and low risk groups. (C, D) TIDE and MSI scores in high risk and low risk group.