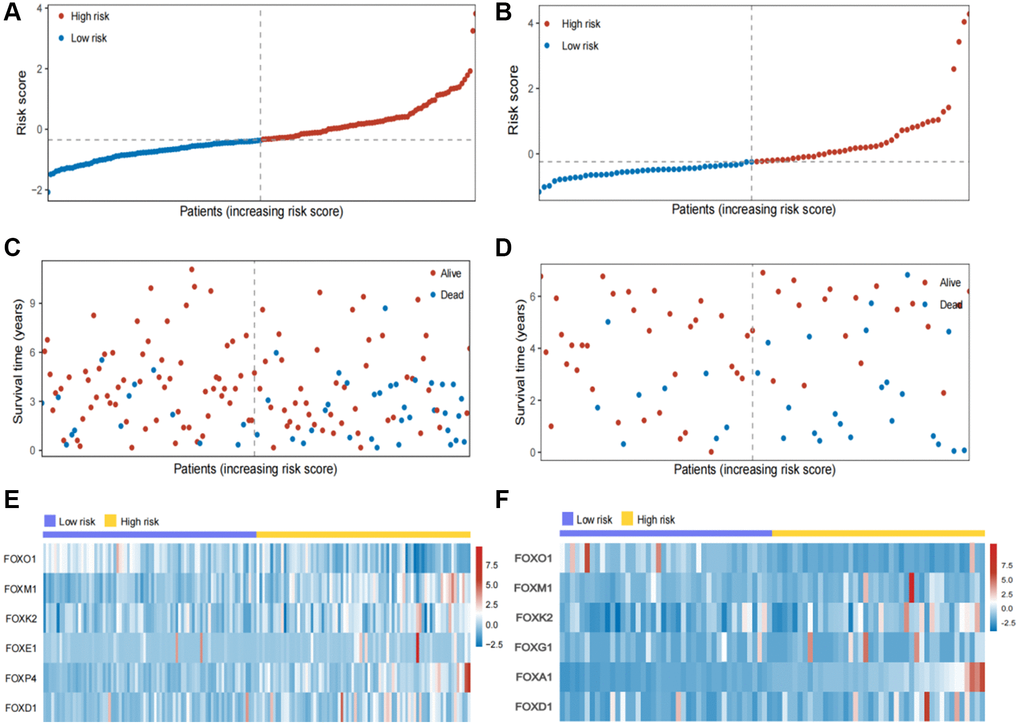
Figure 3.Validation of the six FOX family genes prognosis model. (A, B) KIRC patients’ risk scores in the internal and external testing cohorts. (C, D) KIRC patients’ risk scores in the internal and external testing cohorts. (E, F) Correlation between the risk scores and six FOX family genes expression profile.