Submit an Article
Navigate
Home
Editorial Board
Editorial Policies
Current Volume
Archive
Scientific Integrity
Publication Ethics Statements
Interviews with Outstanding Authors
Newsroom
Sponsored Conferences
Podcast
Contact
Special Collections
Submit an Article
Online ISSN: 1945-4589
Research Paper
|
Volume 14, Issue 24
|
pp. 9969–9979
Fatty acid metabolism-related signature predicts survival in patients with clear cell renal carcinoma
Back to article
Figure 4
(4 of 6)
−
100%
+
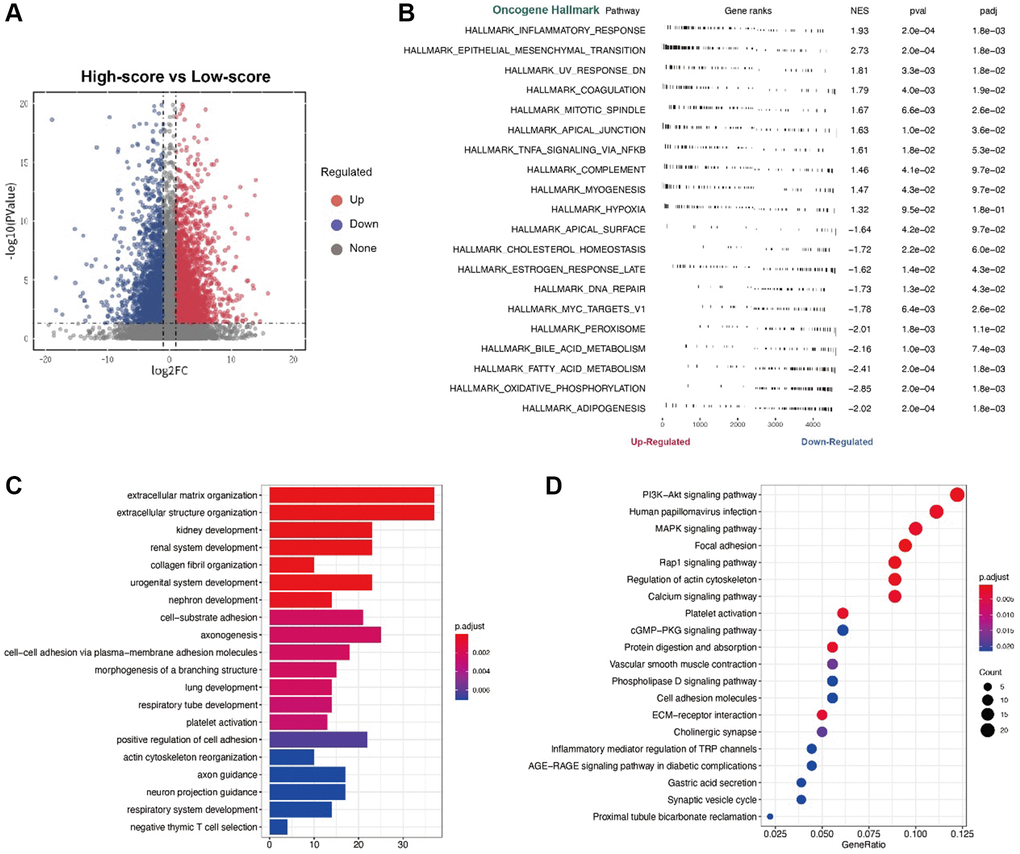
Figure 4.
(
A
) The volcano plot for the different expression level genes; (
B
) The GSVA analysis; (
C
) The GO analysis; (
D
) The KEGG analysis.
Figure 4 — Fatty acid metabolism-related signature predicts survival in patients with clear cell renal carcinoma | Aging