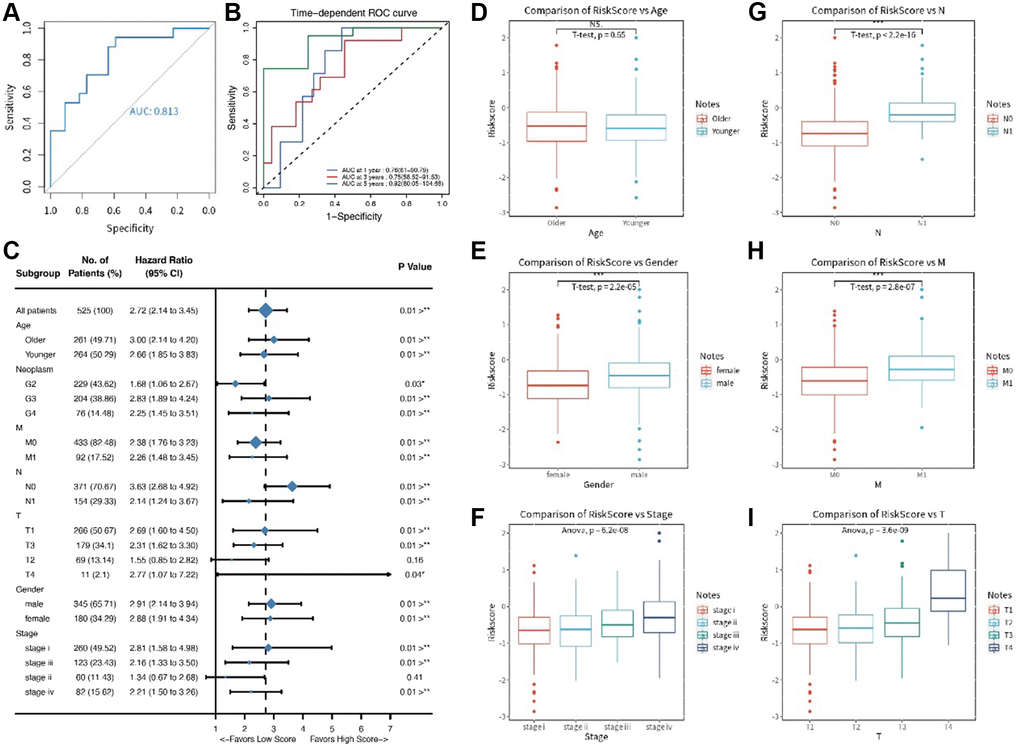
Figure 2.(A, B) The ROC time dependent analysis; (C) The forest plot for clinical features in the training set; (D–I) The comparative results for age, gender, T stage, N stage, M stage, and pathology stage.
Figure 2 — Fatty acid metabolism-related signature predicts survival in patients with clear cell renal carcinoma | Aging