Submit an Article
Navigate
Home
Editorial Board
Editorial Policies
Current Volume
Archive
Scientific Integrity
Publication Ethics Statements
Interviews with Outstanding Authors
Newsroom
Sponsored Conferences
Podcast
Contact
Special Collections
Submit an Article
Online ISSN: 1945-4589
Research Paper
|
Volume 14, Issue 24
|
pp. 9942–9950
Qi Ling decoction enhances abiraterone treatment via suppression of autophagy in castration resistant prostate cancer
Back to article
Figure 1
(1 of 6)
−
100%
+
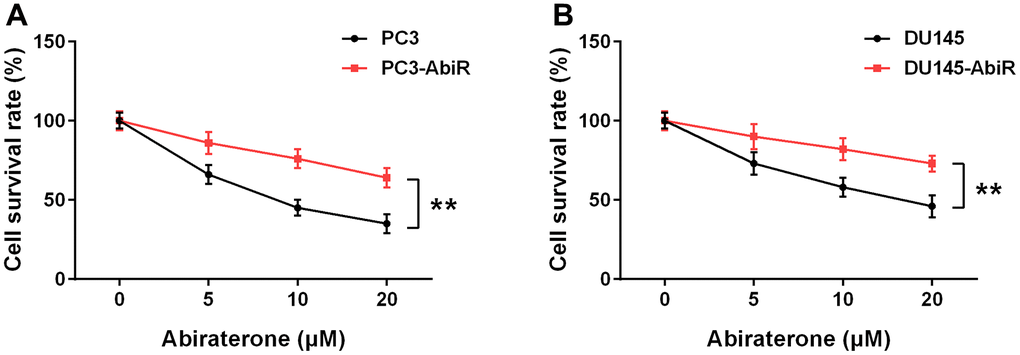
Figure 1.
Resistance to abiraterone in PC3-AbiR (
A
) and DU145-AbiR (
B
) cells. Cells were treated with different concentrations of abiraterone for 48 hours, cell survival rate was calculated. Data were presented as mean ± SD. n=3. **p< 0.01.