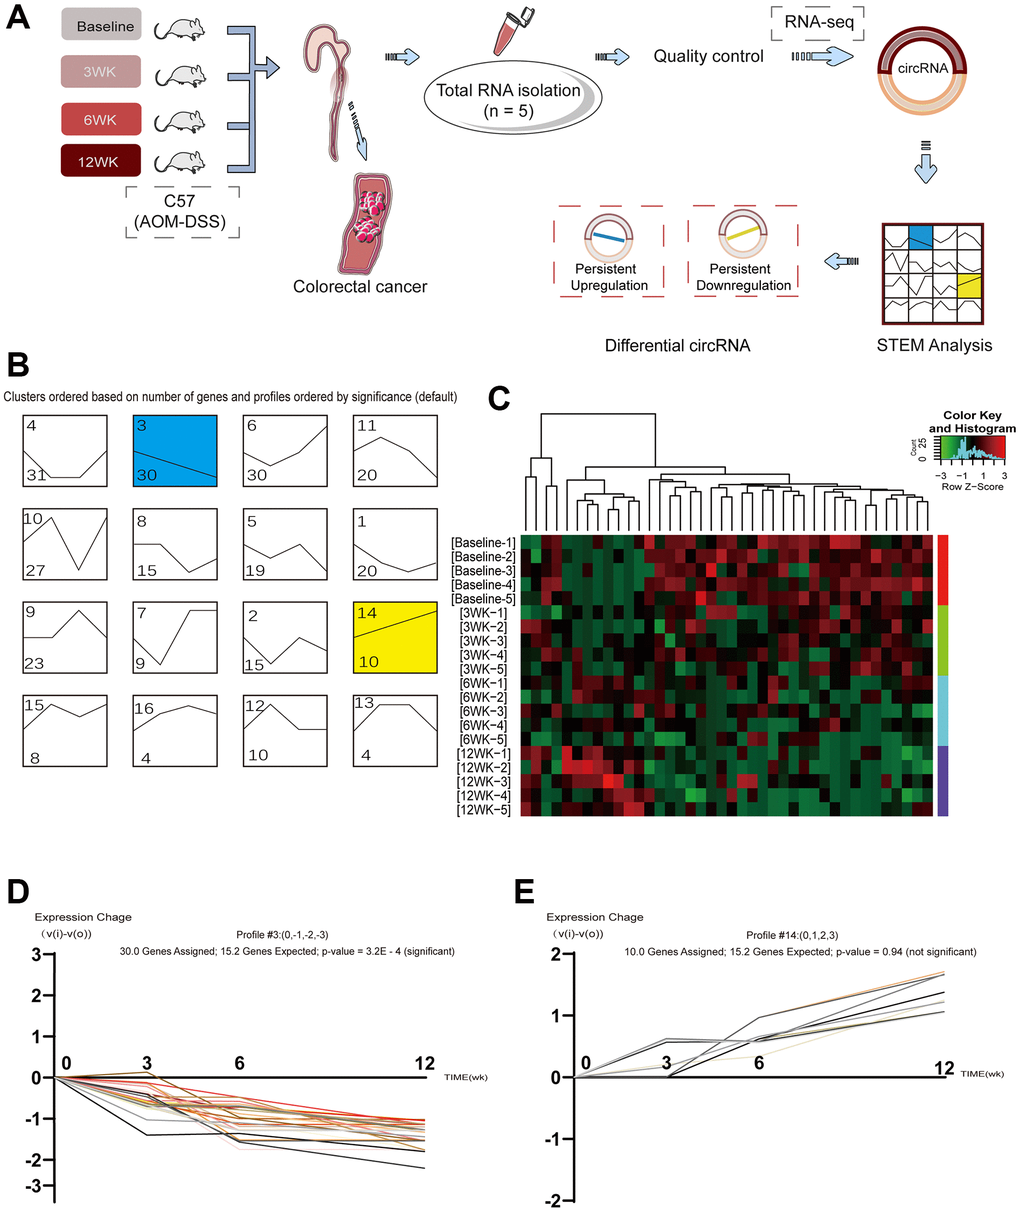
Figure 2.Identification of circular RNAs expressed at different stages in inflammation-based tumorigenesis. (A) Schematic representation of circRNA identification and sequencing; (B) Cluster based on changes in circRNA; (C) Heatmap of the clustering analysis indicating differences in circRNA expression profiles in the stage of “inflammation-CRA-CRC”. Areas colored red and green indicate the upregulation and downregulation of circRNA, respectively; (D) circRNAs with persistent downregulation; (E) circRNAs with persistent upregulation.