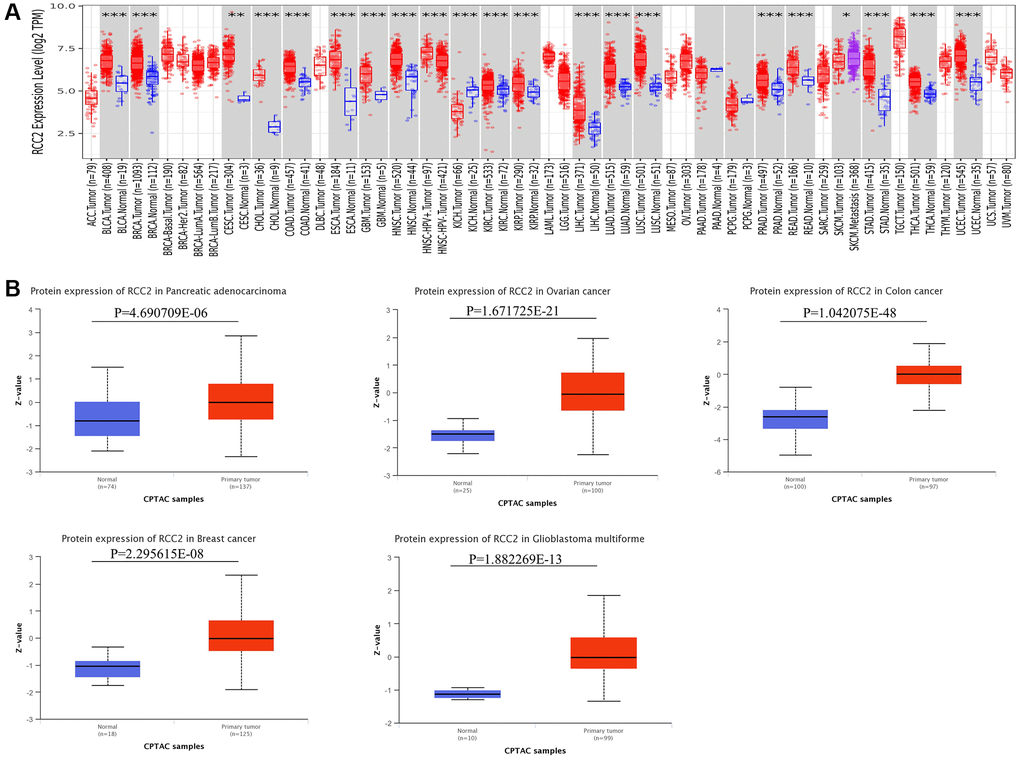
Figure 1.RCC2 mRNA and protein expression in tumor and normal tissues. (A) Expression levels of RCC2 gene in tumor and normal tissues based on TIMER2.0 database. (B) The protein level of RCC2 between normal and different tumor tissues. *p < 0.05; **p < 0.01; ***p < 0.001.