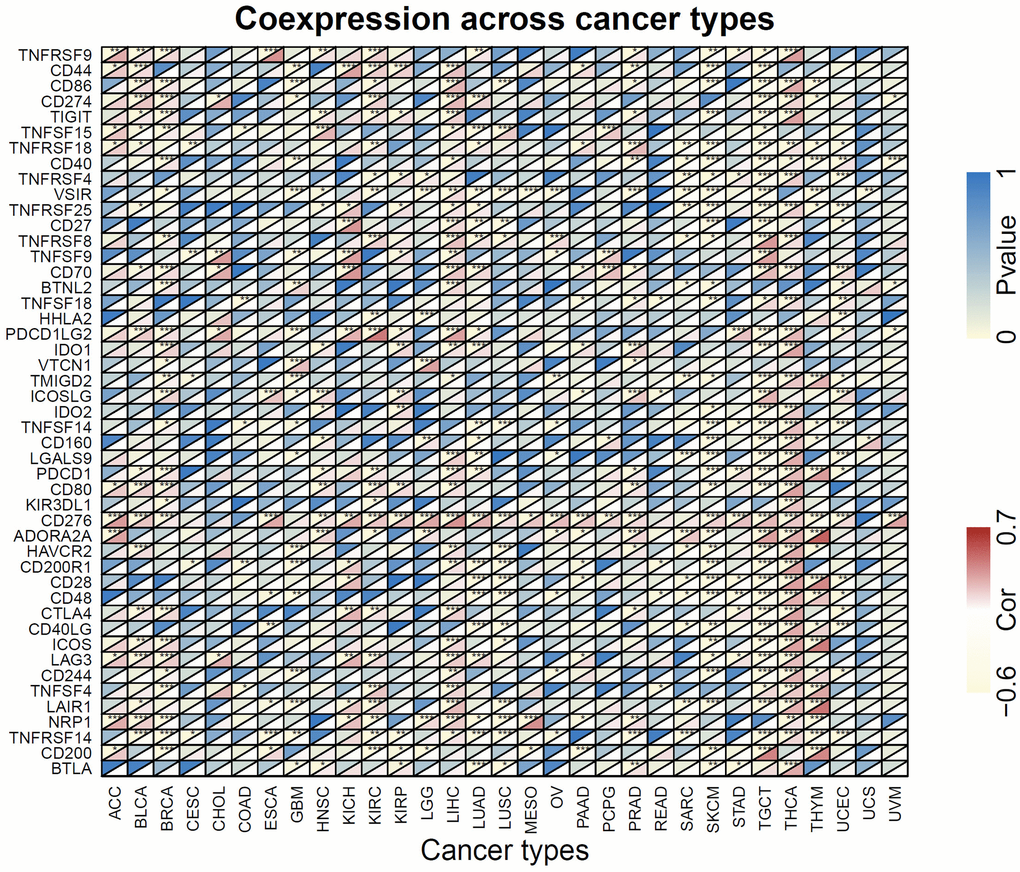
Figure 8.Heatmap of the association of FOXM1 expression with 47 common immune checkpoints gene levels in 31 types of cancers. For each pair, the top left triangle represents the P-value, and the bottom right triangle represents the correlation coefficient. *p < 0.05, **p < 0.01, ***p < 0.001.