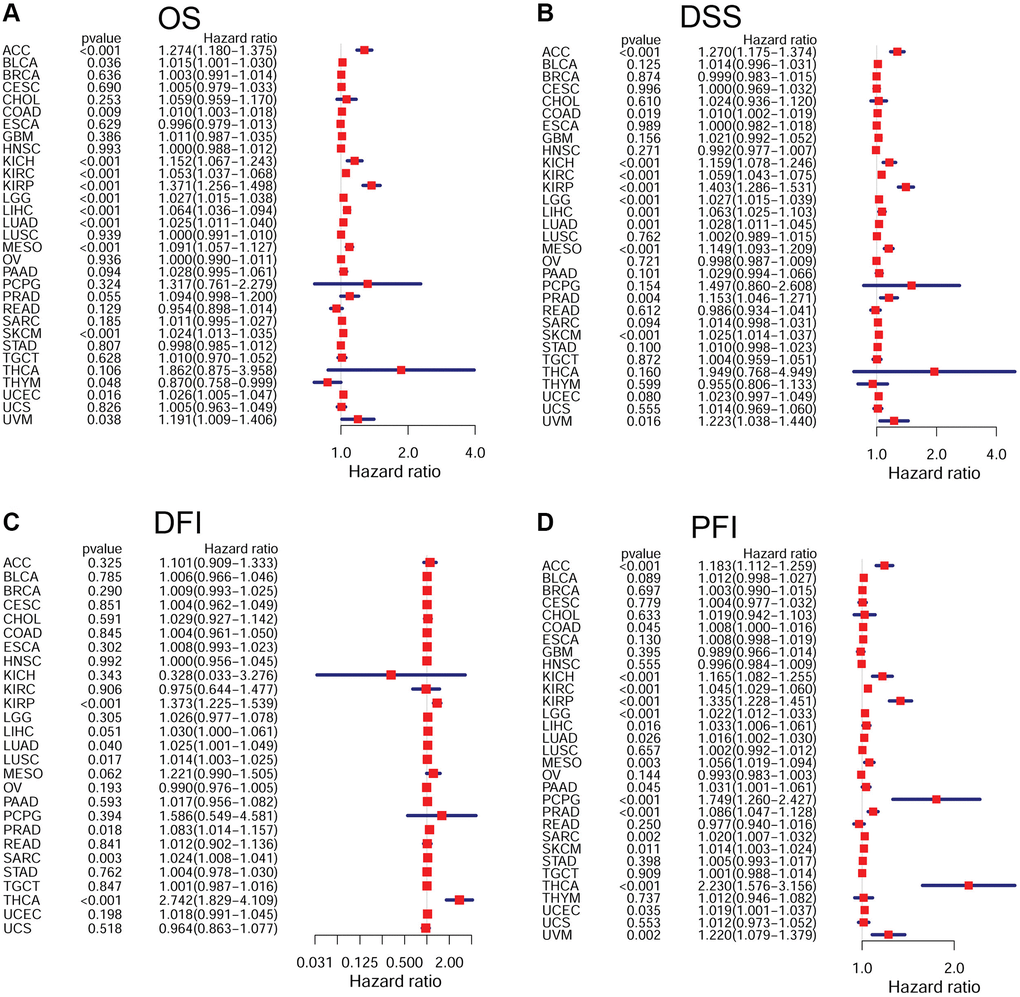
Figure 4.Forest plots of Cox regression analyses in pan-cancer. (A) Association of FOXM1 expression with OS; (B) Association of FOXM1 expression with DSS; (C) Association of FOXM1 expression with DFI; (D) Association of FOXM1 expression with PFI. p < 0.05 was considered significant.