Submit an Article
Navigate
Home
Editorial Board
Editorial Policies
Current Volume
Archive
Scientific Integrity
Publication Ethics Statements
Interviews with Outstanding Authors
Newsroom
Sponsored Conferences
Podcast
Contact
Special Collections
Submit an Article
Online ISSN: 1945-4589
Research Paper
|
Volume 14, Issue 22
|
pp. 8927–8943
The potential benefit of metformin to reduce delirium risk and mortality: a retrospective cohort study
Back to article
Figure 2
(2 of 2)
−
100%
+
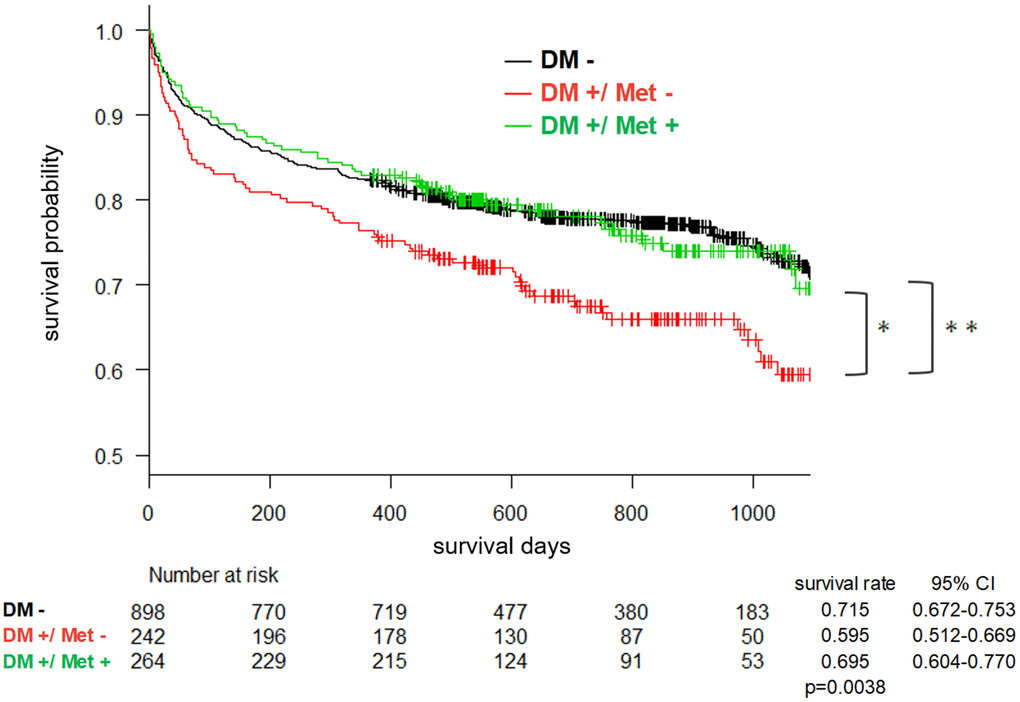
Figure 2.
Kaplan-Meier cumulative survival curve over 3 years based on the three-group comparison.
Figure 2 — The potential benefit of metformin to reduce delirium risk and mortality: a retrospective cohort study | Aging