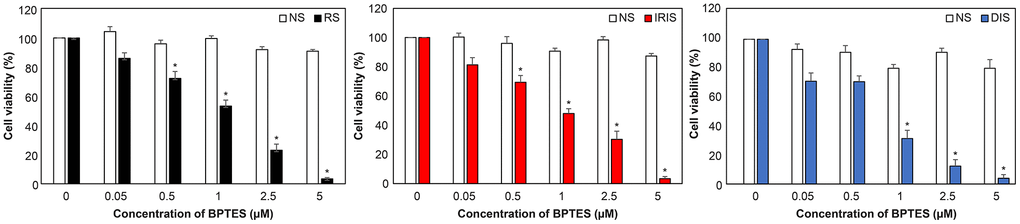
Figure 2.Selective removal of senescent HDFs by treatment with BPTES. After induction of cellular senescence, cells were treated with BPTES at the indicated concentrations for 72 h (n = 4). Cell viability was measured to determine the effect of the senescent cell-removal drugs. Histograms were compared to the DMSO control. The graph shows the mean ± SEM of three independent experiments; *p < 0.05, Mann–Whitney U test; NS: non-senescence.