Submit an Article
Navigate
Home
Editorial Board
Editorial Policies
Current Volume
Archive
Scientific Integrity
Publication Ethics Statements
Interviews with Outstanding Authors
Newsroom
Sponsored Conferences
Podcast
Contact
Special Collections
Submit an Article
Online ISSN: 1945-4589
Research Paper
|
Volume 14, Issue 22
|
pp. 9103–9127
Exploring the mechanisms underlying the therapeutic effect of the
Radix Bupleuri-Rhizoma Cyperi
herb pair on hepatocellular carcinoma using multilevel data integration and molecular docking
Back to article
Figure 3
(3 of 10)
−
100%
+
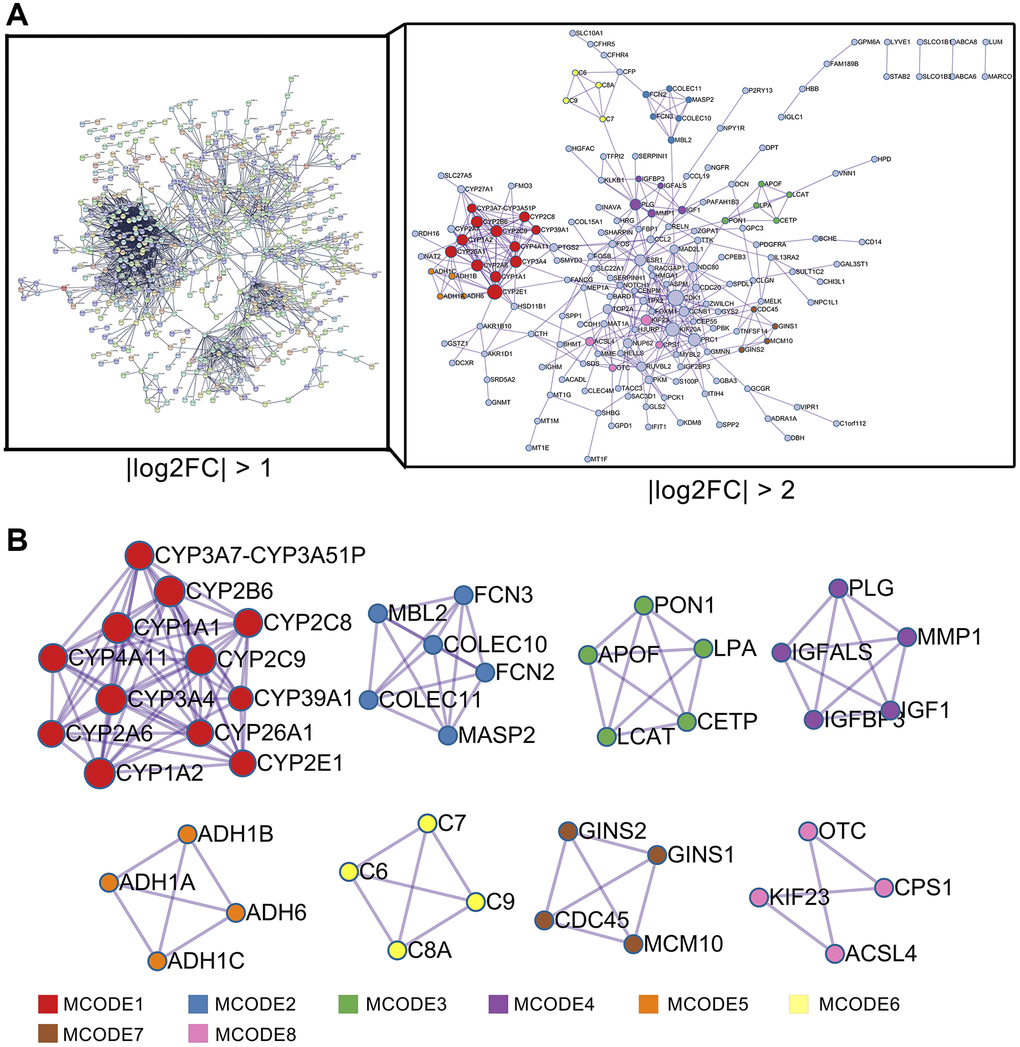
Figure 3.
PPI network analysis of DEGs in HCC.
(
A
) PPI network analysis of 1110 DEGs (right panel, STRING database) and 224 DEGs (left panel, Metascape web tool). (
B
) MCODE module for the gene clustering analysis.