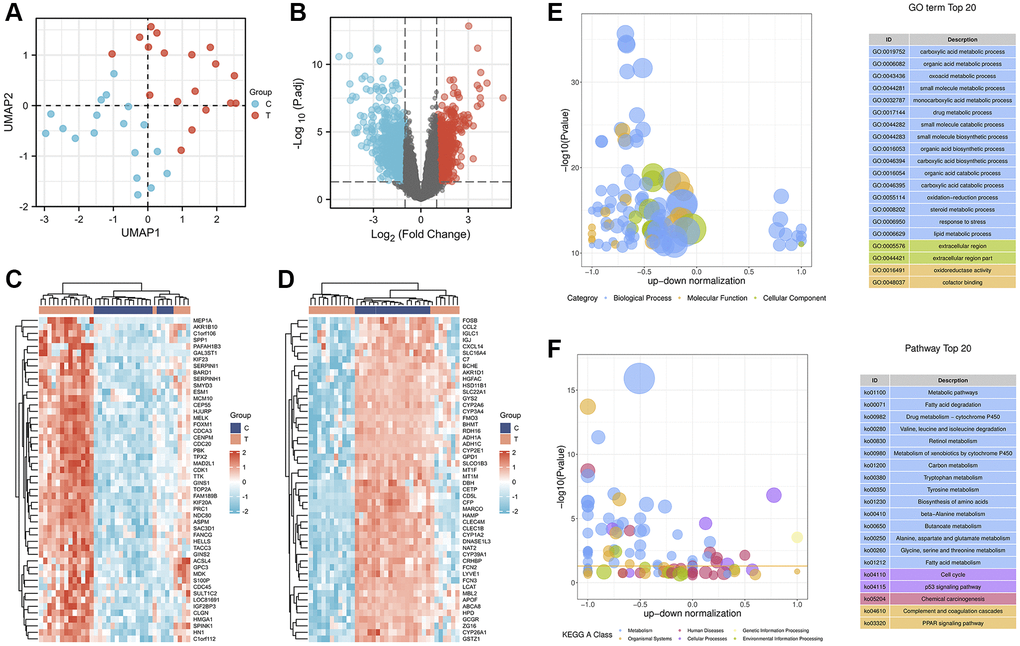
Figure 2.Identification and enrichment analysis of DEGs in adjacent nontumor liver tissues and HCC tissues. (A) The UMAP scatter plot. (B) The expression patterns of DEGs are shown in volcano plots. Red and blue dots represent upregulated genes (log2FC ≥ 1) and downregulated genes (log2FC ≤ −1), respectively, while gray represents genes with no significant difference in expression (P.adj < 0.05). Heatmap analysis of the top 50 up- (C) and downregulated (D) DEGs. Bubble plot showing the top 20 enriched GO terms (E) and KEGG (F) pathways. The larger the ordinate value in the bubble chart, the more significant the corresponding GO or KEGG result. The abscissa represents the normalized upregulation and downregulation value (the ratio of the difference between the number of upregulated genes and the number of downregulated genes to the total number of DEGs). The higher the value, the greater the number of upregulated genes enriched in the GO/KEGG pathway; conversely, the lower the value, the higher the number of downregulated genes enriched in the GO/KEGG pathway.