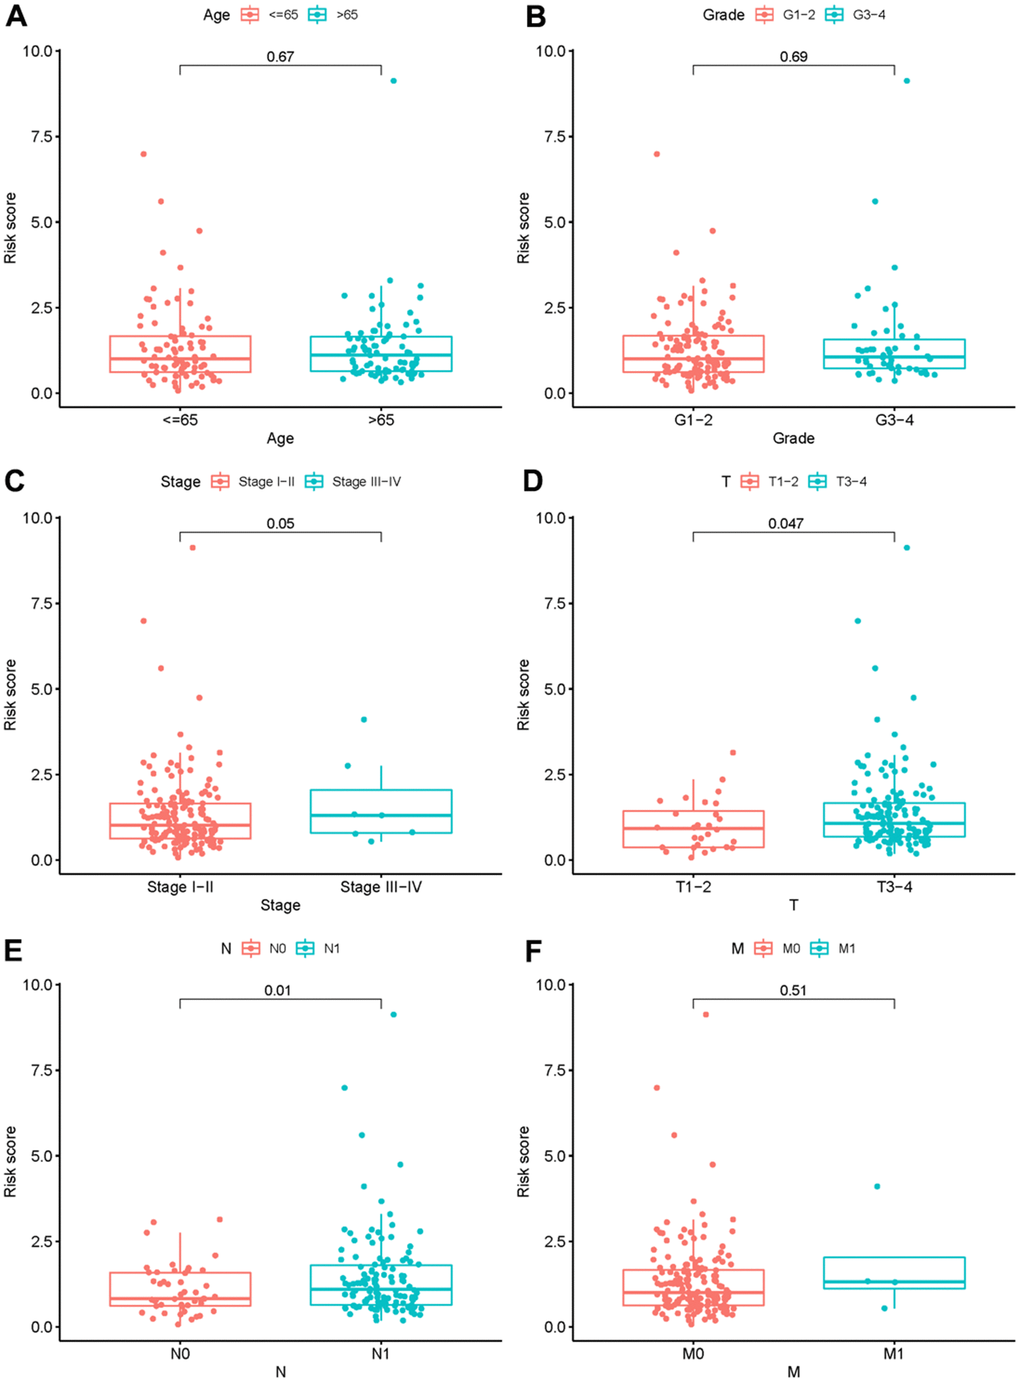
Figure 4.The relationship between the risk score and clinical features. Relationships between risk score and age (A), grade (B), stage (C), T- stage (D), N- stage (E) and M- stage (F).
Figure 4 — A novel risk score model based on four angiogenesis long non-coding RNAs for prognosis evaluation of pancreatic adenocarcinoma | Aging