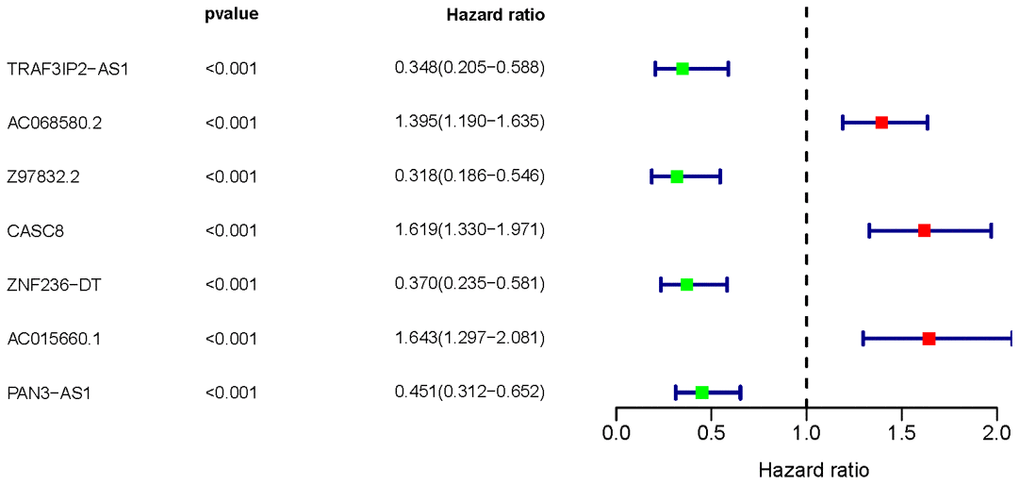
Figure 1.Survival-related ARLNRs forest plot. The hazard ratios of sARLNRs (TRAF3IP2-AS1, AC068580.2, Z97832.2, CASC8, ZNF326-DT, AC015660.1 and PAN3-AS1) were demonstrated in the forest plot. Red parts represent up-regulated sARLNRs, and green parts represent down-regulated sARLNRs.