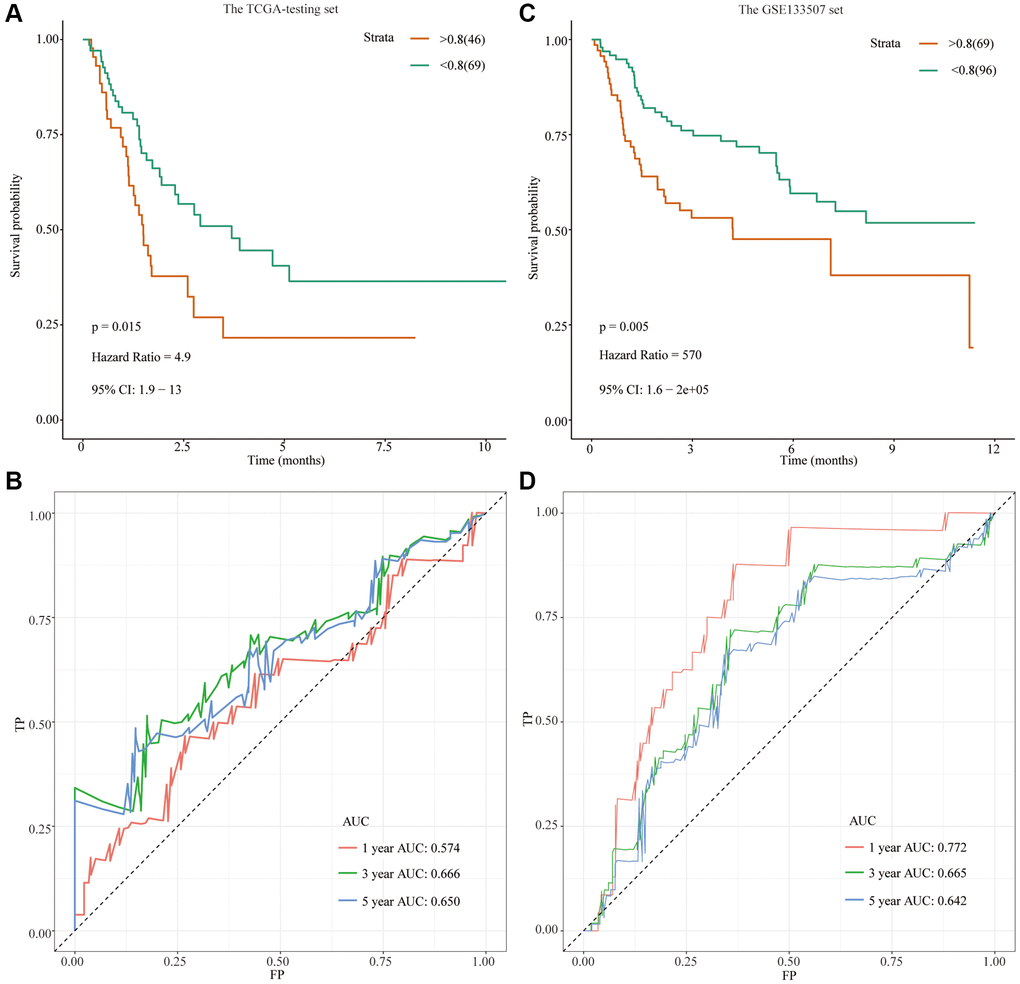
Figure 3.Development of a prognostic signature based on FRGs in the TCGA-testing set and GSE13507 cohort. (A) Survival analysis for the signature-defined risk groups in the TCGA-testing set; (B) Time-dependent ROC curve of the 11- FRGs prognostic signature in the TCGA-testing set; (C) Survival analysis for the signature-defined risk groups in the GSE13507 cohort; (D) Time-dependent ROC curve of the 11- FRGs prognostic signature in the GSE13507 cohort.