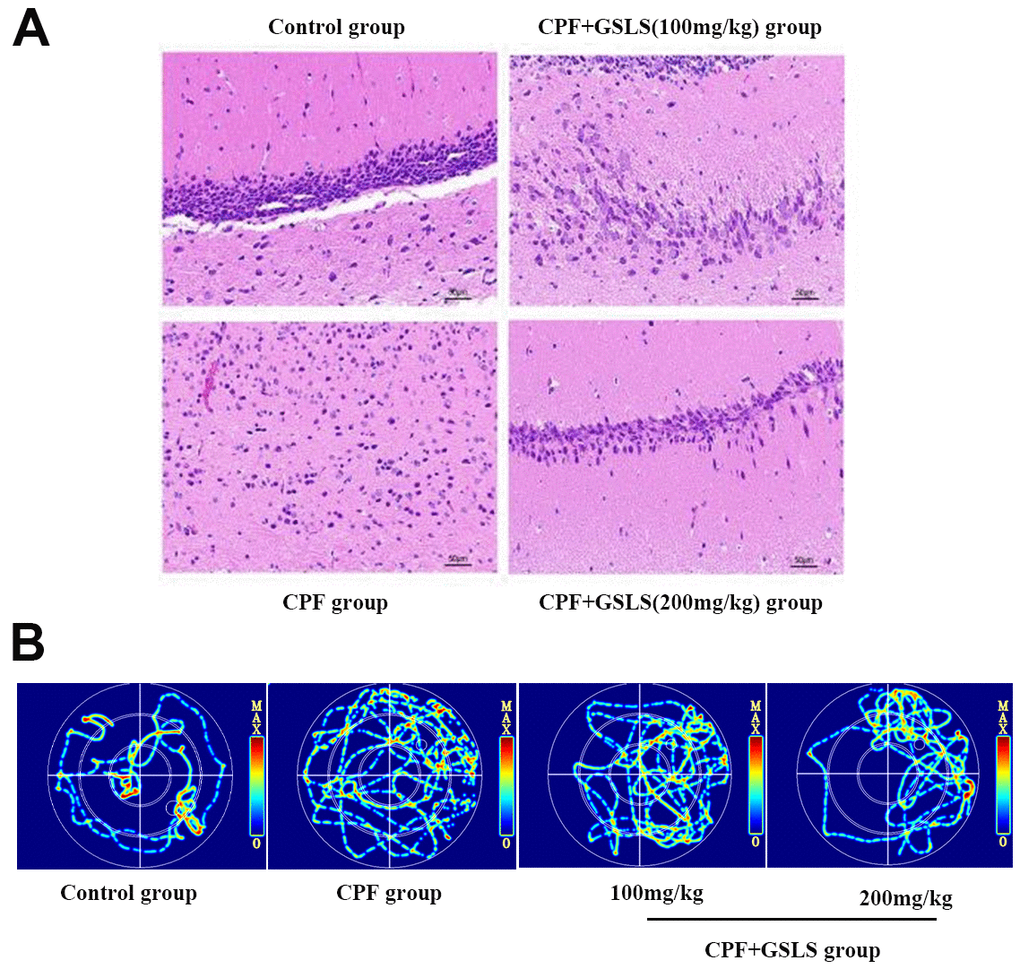
Figure 7.(A) HE staining of pathological changes in mouse hippocampi (magnification: 400 ×, n = 10 in each group). (B) Thermal infrared track diagram of mouse moving in Morris water maze.
Figure 7 — Protective effect of total saponins of ginseng stems and leaves (GSLS) on chlorpyrifos-induced brain toxicity in mice through the PTEN/PI3K/AKT axis | Aging