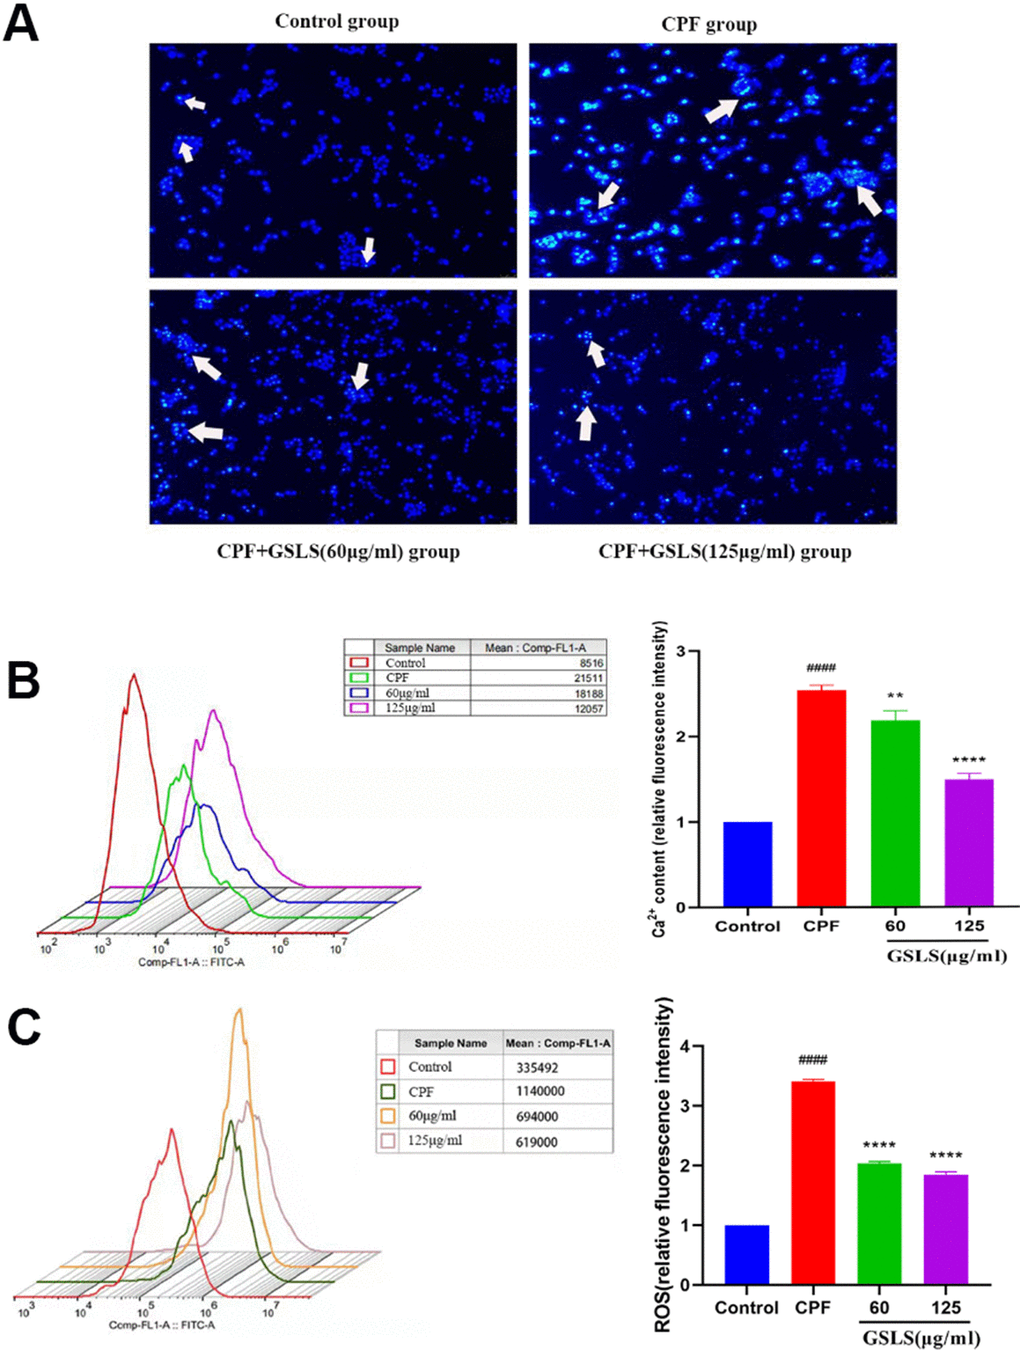
Figure 3.(A) Hoechst 33342 staining assessment. (B) Detection of intracellular Ca2+ concentration. (C) Detection of reactive oxygen species (ROS). #p < 0.05, ##p < 0.01, ###p < 0.001, ####p < 0.0001 vs. control group; *p < 0.05, **p < 0.01, ***p < 0.001, ****p < 0.0001 vs. CPF group.