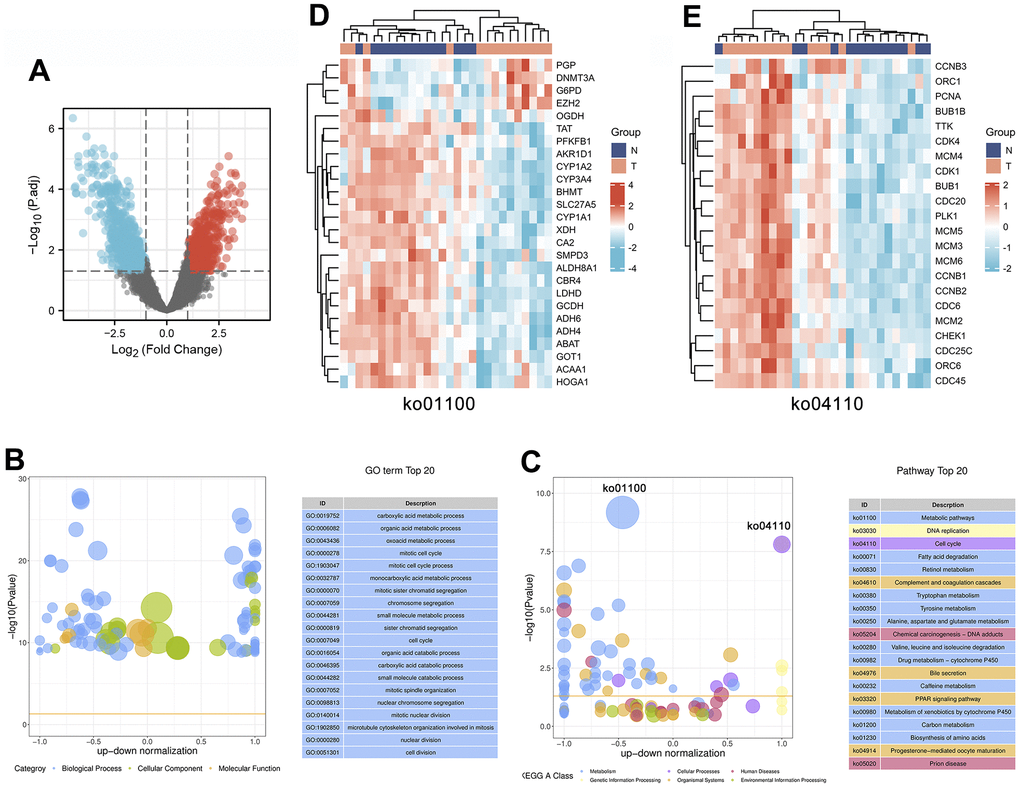
Figure 2.Identification and enrichment analysis of differentially expressed genes in 14 pairs of HCC tissues and corresponding noncancerous tissues. (A) The expression patterns of the DEGs are shown in volcano plots. Red and blue points represent upregulated genes (log2FC ≥ 1) and downregulated genes (log2FC ≤ -1), respectively, while gray represents genes with no significant difference in expression (P.adj < 0.05). (B, C) Bubble plot showing the top 20 GO (B) and KEGG (C) enrichment analysis results. The larger the ordinate value in the bubble chart, the more significant the corresponding GO or KEGG result is. The abscissa represents the normalized upregulation and downregulation value (the ratio of the difference between the number of upregulated genes and the number of downregulated genes to the total number of differentially expressed genes). The higher the value is, the higher the number of upregulated genes enriched in the GO/KEGG pathway results; conversely, the lower the value is, the higher the number of downregulated genes enriched in the GO/KEGG pathway results. (D, E) Heatmaps showing the expression patterns of genes involved in the cell cycle (ko04110) or metabolic pathways (ko01100).