Submit an Article
Navigate
Home
Editorial Board
Editorial Policies
Current Volume
Archive
Scientific Integrity
Publication Ethics Statements
Interviews with Outstanding Authors
Newsroom
Sponsored Conferences
Podcast
Contact
Special Collections
Submit an Article
Online ISSN: 1945-4589
Research Paper
|
Volume 14, Issue 22
|
pp. 8900–8913
Denervation induces mitochondrial decline and exacerbates lysosome dysfunction in middle-aged mice
Back to article
Figure 7
(7 of 7)
−
100%
+
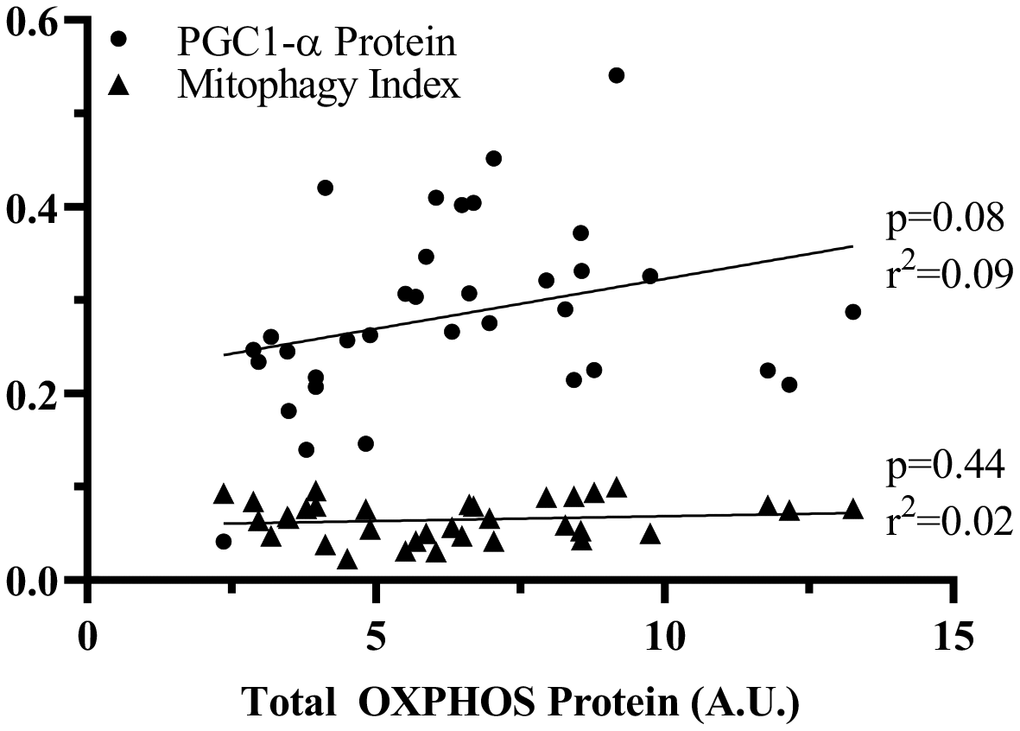
Figure 7.
Correlation of PGC1-α or mitophagy index to OXPHOS protein.
Linear correlations were analyzed to assess the contribution of PGC-1α and mitophagy to change in total OXPHOS protein. p values and r
2
values are represented on the graph.