Submit an Article
Navigate
Home
Editorial Board
Editorial Policies
Current Volume
Archive
Scientific Integrity
Publication Ethics Statements
Interviews with Outstanding Authors
Newsroom
Sponsored Conferences
Podcast
Contact
Special Collections
Submit an Article
Online ISSN: 1945-4589
Research Paper
|
Volume 14, Issue 21
|
pp. 8585–8594
Abnormal myocardial enzymes in the prediction of mortality and hypertension in COVID-19 patients: a retrospective study
Back to article
Figure 3
(3 of 3)
−
100%
+
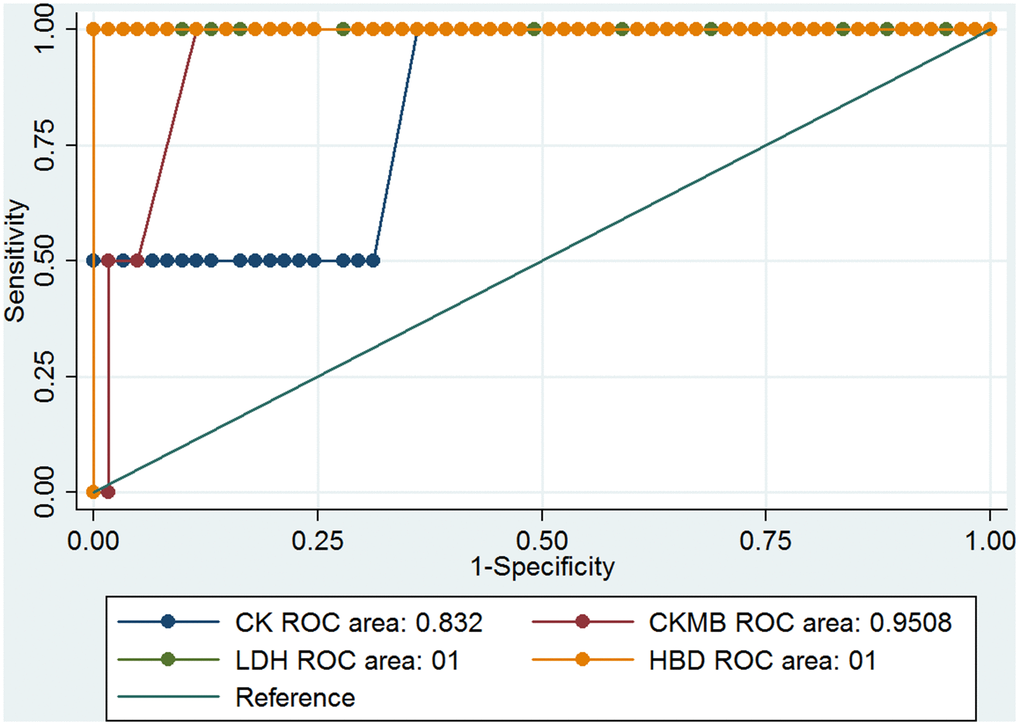
Figure 3.
The ROC curves of CK, CK-MB, LDH, and α-HBD in the non-hypertensive COVID-19 patients.