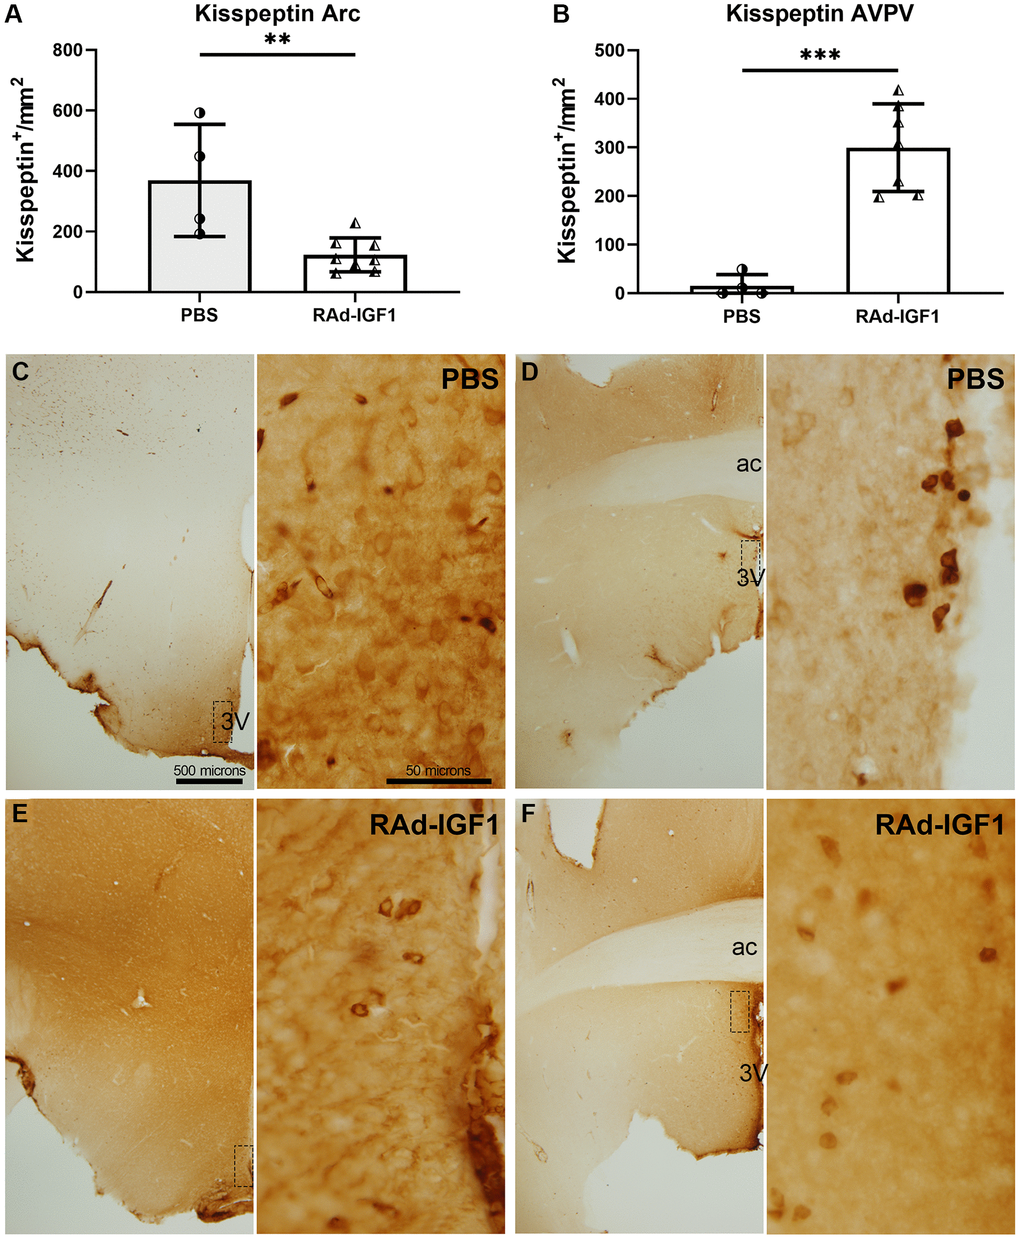
Figure 5.IGF1 gene therapy effect on the kisspeptin immunopositive cells. (A and B) Quantification of kisspeptin immunopositive cells. Error bars represent SD (NRAd-IGF1 = 7; NPBS = 4). Two-tailed t-test was used. Asterisks indicate significant (**p < 0.005; ***p < 0.001) differences. Figure 5A post hoc power (1-β) analysis: 0.7533; Figure 5B post hoc power (1-β) analysis: 0.9999. (C–F) Immunohistochemistry for kisspeptin of control (PBS) and experimental (RAd-IGF1) rat’s brain slides at a magnification of 40× (scale bar: 500 microns), with insets at a magnification of 600× (scale bar: 50 microns). 3V: third ventricle; ac: anterior commissure.