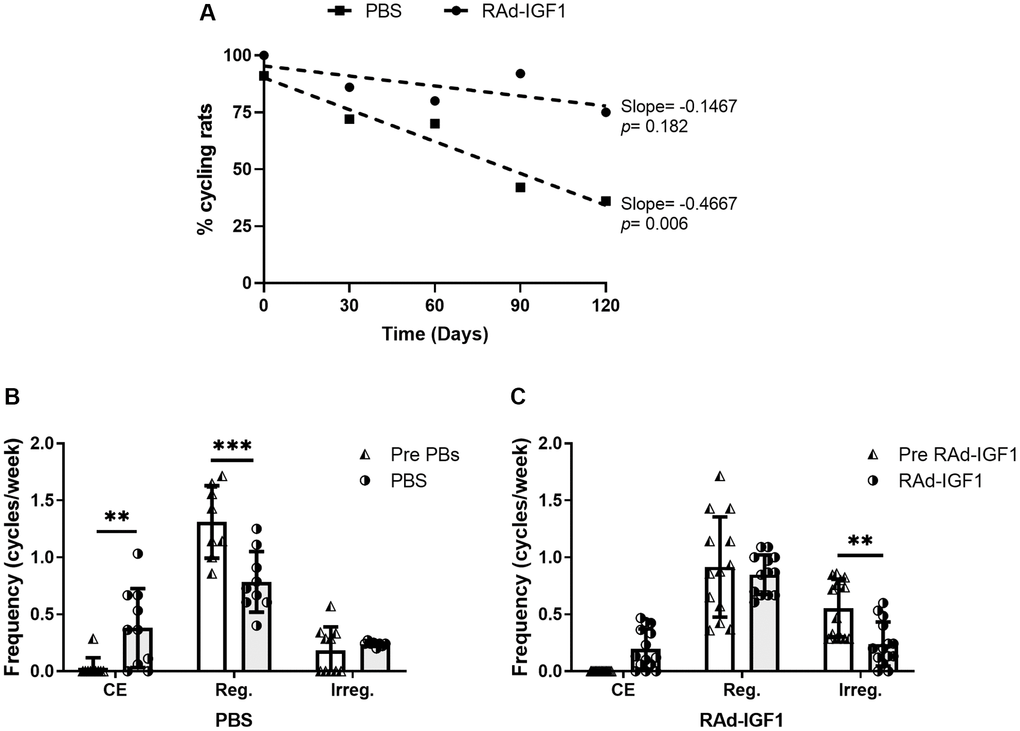
Figure 1.IGF1 gene therapy effect on cyclicality status in MA female rats. (A) IGF1 gene therapy effect on the proportion of cycling rats. Significant (p < 0.05) negative slope indicate a decrease of cycling rat in control group (PBS) along the experiment. (B and C) IGF1 gene therapy effect on the frequency of cycles. Rats had their vaginal cytology assessed daily from day −30 to 120. The frequencies were calculated as the number of cycles per week for the pretreatment period (day −30 to 0) and the treatment period (day 0 to 120). Abbreviations: CE: Constant Estrus (5 days of Estrus); Reg: Regular (1 day of Proestrus, 1 day of Estrus, 2–3 days of Metestrus/Diestrus); Irreg: Irregular. Error bars represent SD (NRAd-IGF1 = 13; NPBS = 9). ANOVA followed by the Bonferroni's multiple comparisons test was used. Asterisks indicate significant (**p < 0.005; ***p < 0.001) differences vs. respective pretreatment value. Figure 1B post hoc power (1-β) analysis: 0.907 (Factor A); 0.953 (Factor B). Figure 1C post hoc power (1-β) analysis: 0. 985 (Factor A); 0. 994 (Factor B).
Figure 1 — IGF1 gene therapy in middle-aged female rats delays reproductive senescence through its effects on hypothalamic GnRH and kisspeptin neurons | Aging