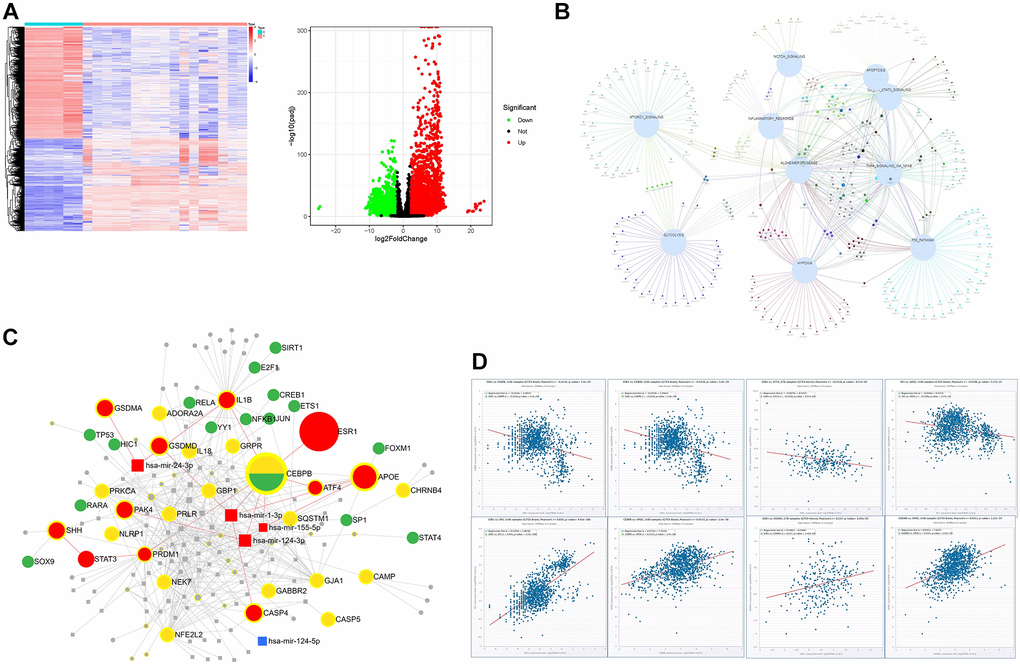
Figure 2.The bioinformatics analysis of the dataset GSE139549. (A) The heatmap and volcano plots representation of DEGs; (B) The interaction of DEGs between GSE139549 and HALLMARK enrichment derived from GSE153250; (C) Target gene-TF-miRNA network of the intersected DEGs between HALLMARK enrichment and GSE139549; (D) Co-expression of TF or genes in tissues of brain and nerve.