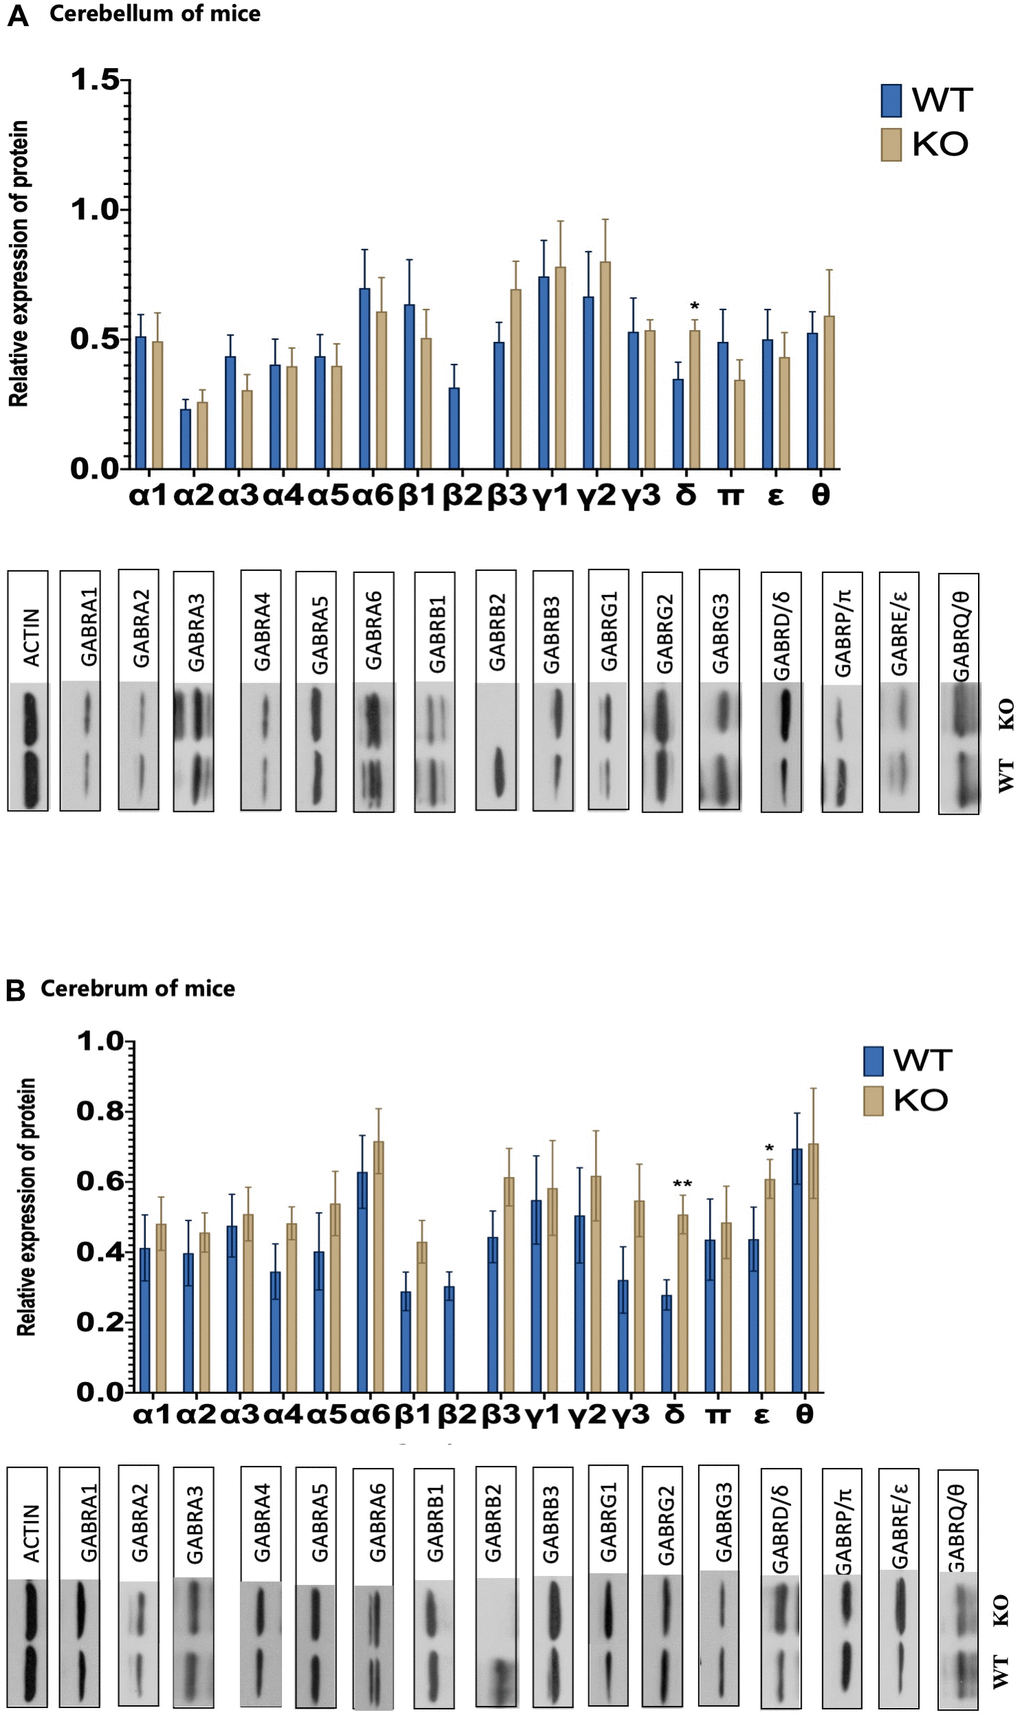
Figure 2.GABAAR receptor subunits changes. (A) The levels of protein expression for 16 different GABA A receptor subunits of WT and KO mouse in the cerebrum (WT male =8, KO male= 8). (B) The levels of protein expression for 16 different GABA A receptor subunits of WT and KO mouse in the cerebellum (WT male =8, KO male=8). Statistical analysis was performed using one-way ANOVA with Newman–Keuls post-hoc test. Average y values ± SEM in the different plots are represented by horizontal bars. *p < 0.05, **p < 0.01, ***p < 0.001.