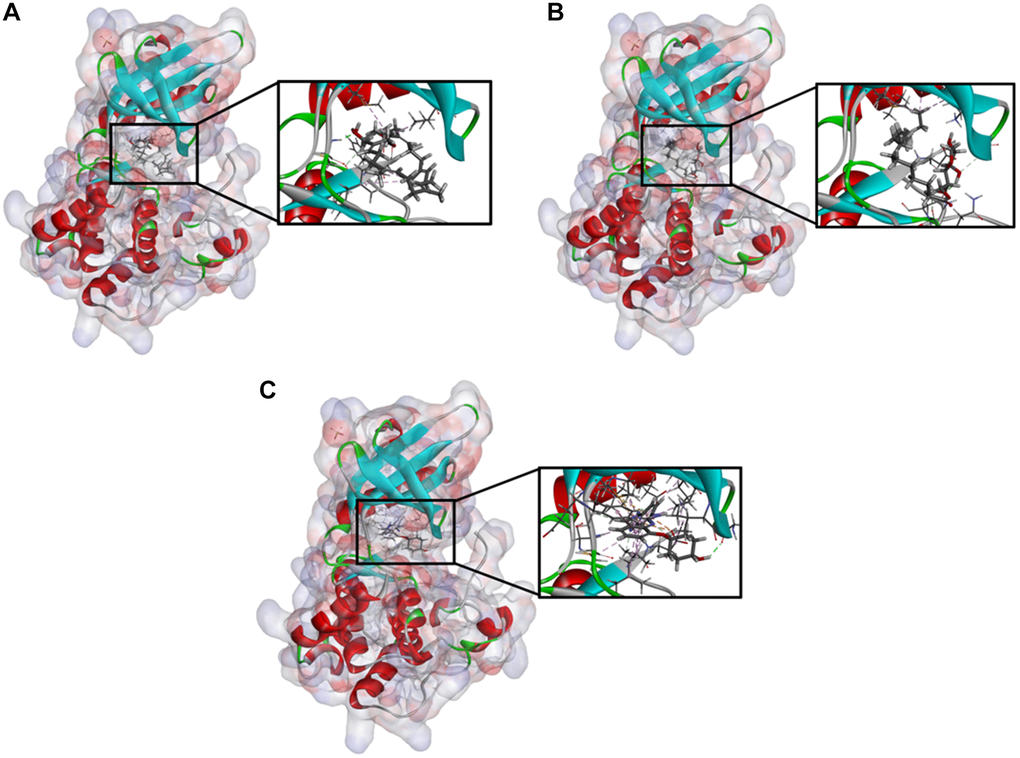
Figure 2.Schematic drawing of interactions between ligands and TNIK. The surface of binding areas were added. Blue represents positive charge; red represents negative charge; and ligands were shown in sticks, with the structure around the ligand-receptor junction shown in thinner sticks. (A) ZINC000040976869-TNIK complex. (B) ZINC000008214460-TNIK complex. (C) NCB-0846-TNIK complex.