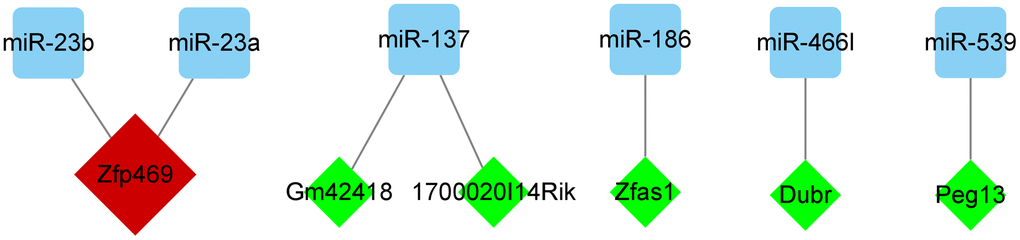
Figure 8.Regulatory network of miRNAs and its targeted lncRNAs. Cytoscape v. 3.8.2 software was used to visualize the relationship between miRNAs and their targeted lncRNAs. The green diamond nodes denote the lncRNAs and blue square nodes denote the miRNAs. LncRNAs targeting two miRNAs are shown in red.