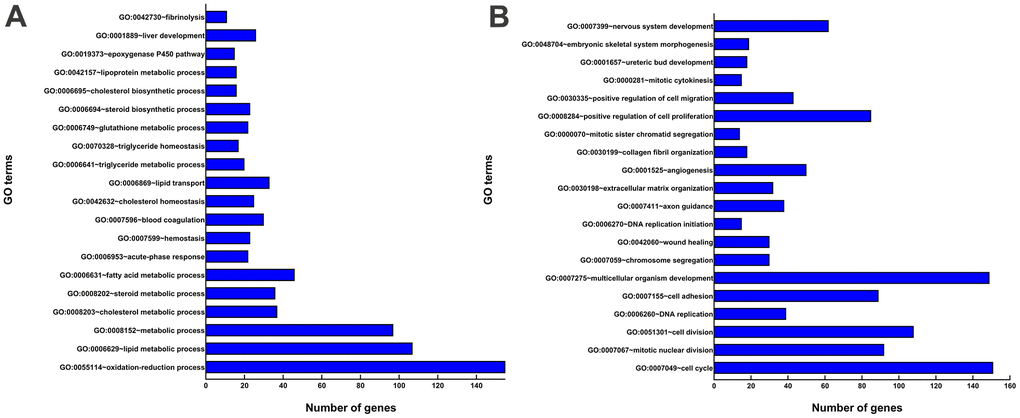
Figure 4.GO enrichment analyses of DEGs. (A) The top 20 GO terms enriched for the upregulated genes. (B) The top 20 GO terms enriched for the downregulated genes. The x-axis shows the number of genes contained in GO terms. The y-axis shows GO terms with significantly enriched DEGs.