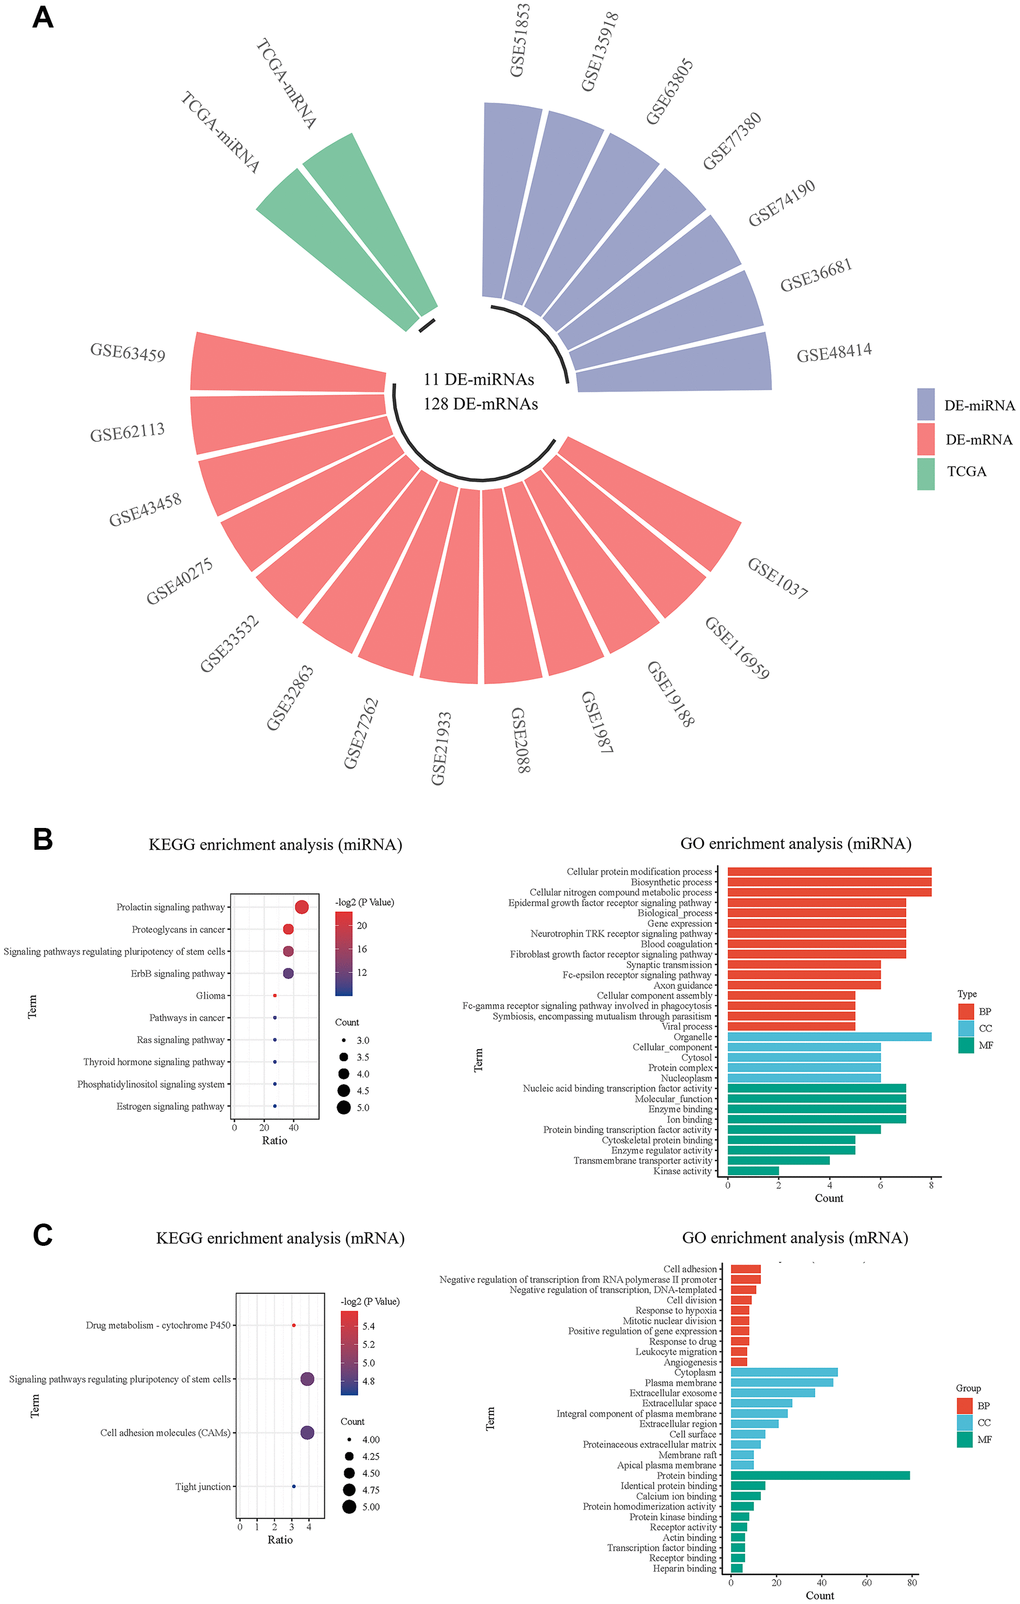
Figure 2.Screening and pathway analysis of DE-miRNAs and DE-mRNA. (A) The circular bar chart showing the datasets from different sources for screening differentially expressed miRNAs and mRNAs; (B) The KEGG and GO enrichment analysis of DE-miRNAs; (C) The KEGG and GO enrichment analysis of DE-mRNAs.