Submit an Article
Navigate
Home
Editorial Board
Editorial Policies
Current Volume
Archive
Scientific Integrity
Publication Ethics Statements
Interviews with Outstanding Authors
Newsroom
Sponsored Conferences
Podcast
Contact
Special Collections
Submit an Article
Online ISSN: 1945-4589
Research Paper
|
Volume 14, Issue 19
|
pp. 7926–7940
Identification of ACSF gene family as therapeutic targets and immune-associated biomarkers in hepatocellular carcinoma
Back to article
Figure 3
(3 of 7)
−
100%
+
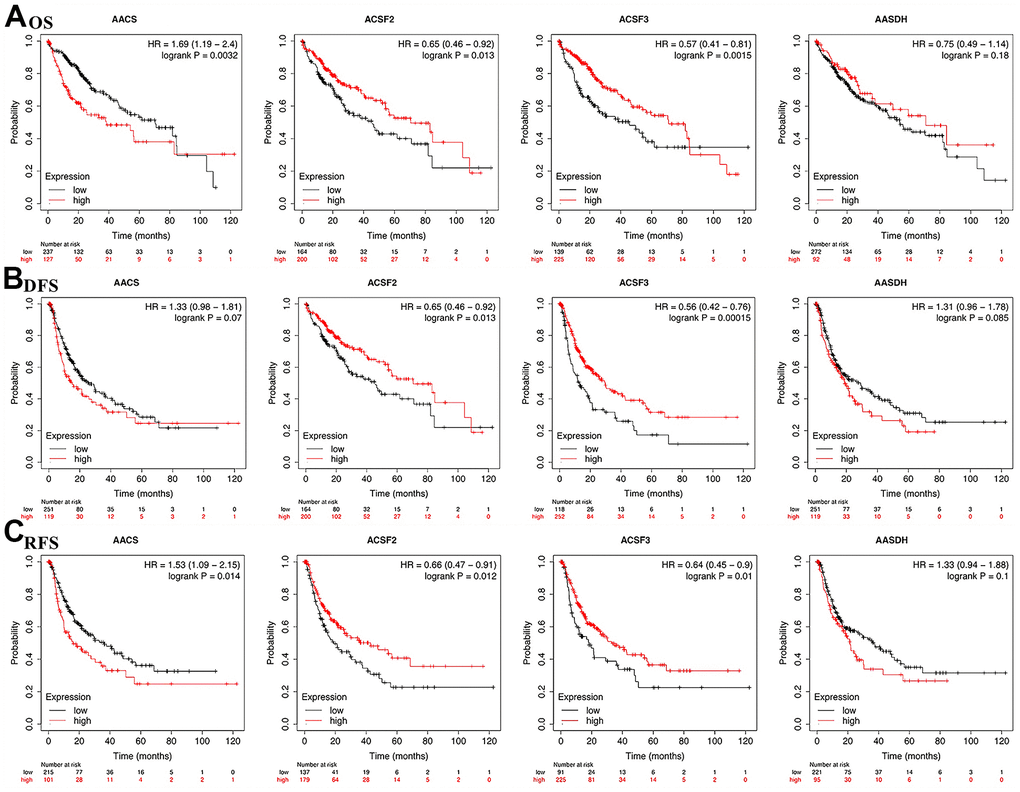
Figure 3.
The correlations of ACSF gene family expression with OS and PFS in HCC patients.
(
A
–
C
) Kaplan-Meier plotter was used to assess the correlation of ACSF gene family members with the patients’ OS (
A
), DFS (
B
) and RFS (
C
).