Submit an Article
Navigate
Home
Editorial Board
Editorial Policies
Current Volume
Archive
Scientific Integrity
Publication Ethics Statements
Interviews with Outstanding Authors
Newsroom
Sponsored Conferences
Podcast
Contact
Special Collections
Submit an Article
Online ISSN: 1945-4589
Research Paper
|
Volume 15, Issue 3
|
pp. 675–688
Ros-mediated mitochondrial oxidative stress is involved in the ameliorating effect of ginsenoside GSLS on chlorpyrifos-induced hepatotoxicity in mice
Back to article
Figure 4
(4 of 9)
−
100%
+
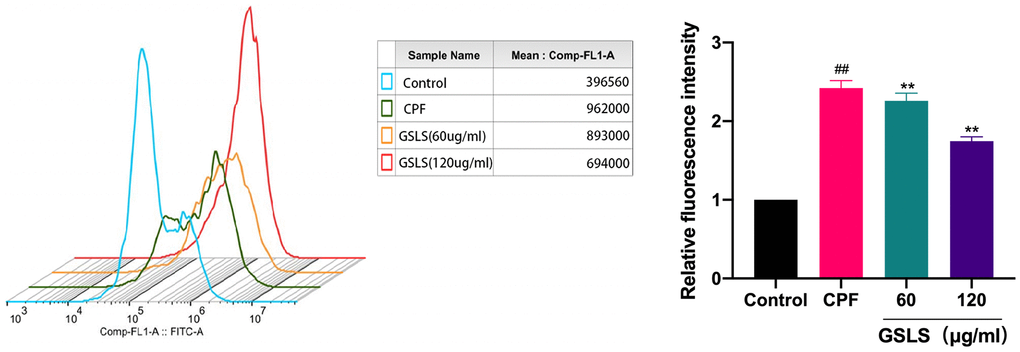
Figure 4.
Flow cytometry analysis of reactive oxygen species (ROS) induced by CPF.
Data are mean ± standard deviation,
n
= 3.
#
p
< 0.05,
##
p
< 0.01 vs. control group;
*
p
< 0.05,
**
p
< 0.01 vs. CPF group.