Submit an Article
Navigate
Home
Editorial Board
Editorial Policies
Current Volume
Archive
Scientific Integrity
Publication Ethics Statements
Interviews with Outstanding Authors
Newsroom
Sponsored Conferences
Podcast
Contact
Special Collections
Submit an Article
Online ISSN: 1945-4589
Research Paper
|
Volume 14, Issue 17
|
pp. 7026–7037
Clinical significance and potential mechanism of heat shock factor 1 in acute myeloid leukemia
Back to article
Figure 3
(3 of 7)
−
100%
+
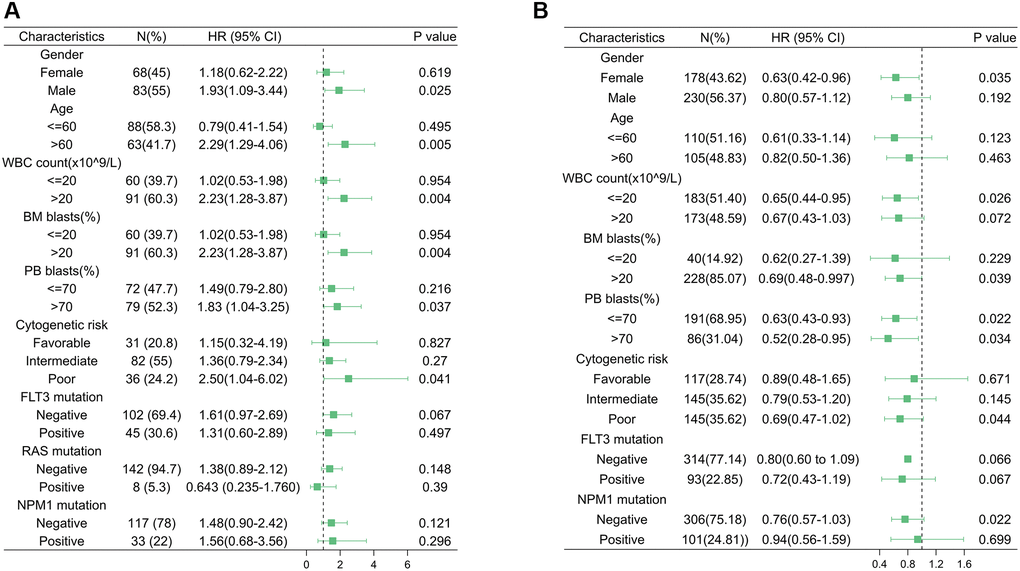
Figure 3.
Acute myeloid leukemia subgroup overall survival analyses.
Forest plot of Cox analyses of HSF1 for different subgroups based on data from The Cancer Genome Atlas (TCGA) (
A
) and Vizome (
B
).