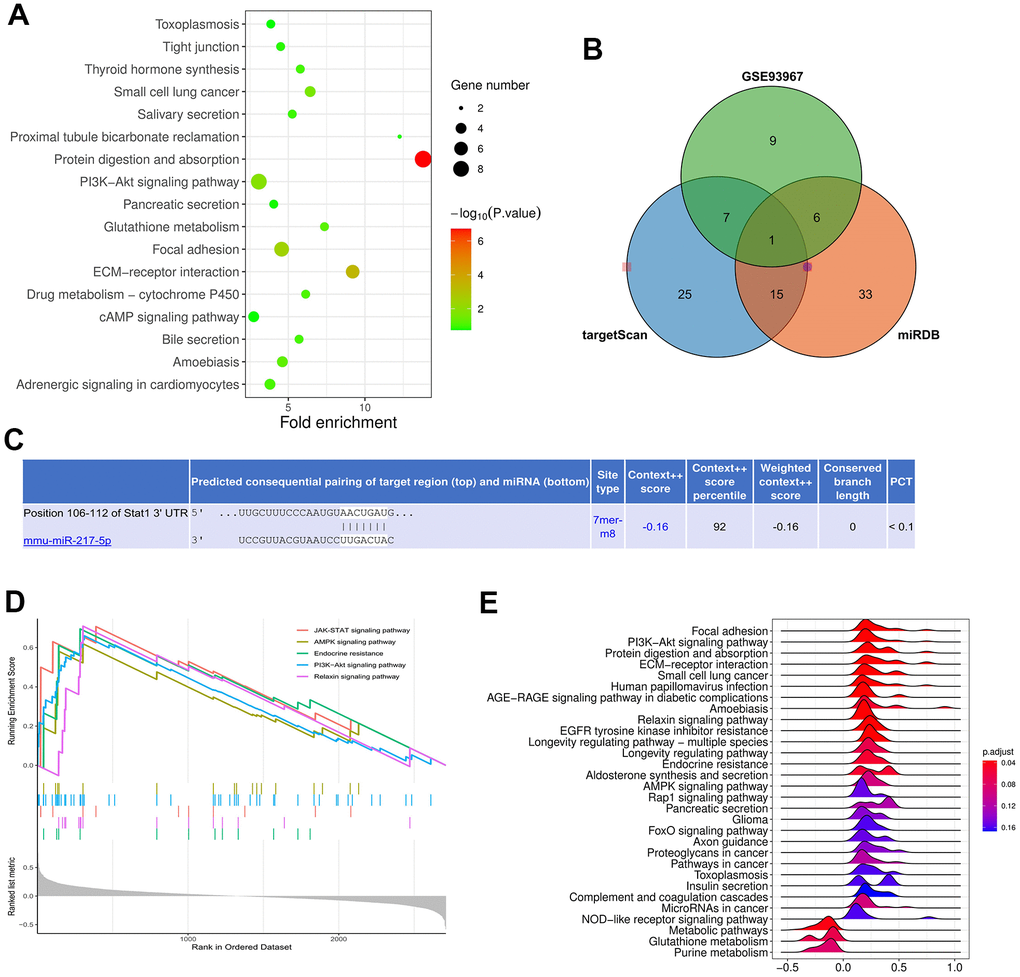
Figure 3.Prediction of miRNA target genes. (A) showed the KEGG pathway diagram. (B, C) represented Venn diagram and binding sites of mRNA and miRNA. (D, E) showed that JAK-STAT and AMPK signaling pathways were enriched pathways.
Figure 3 — MiR-217-5p inhibits smog (PM2.5)-induced inflammation and oxidative stress response of mouse lung tissues and macrophages through targeting STAT1 | Aging