Submit an Article
Navigate
Home
Editorial Board
Editorial Policies
Current Volume
Archive
Scientific Integrity
Publication Ethics Statements
Interviews with Outstanding Authors
Newsroom
Sponsored Conferences
Podcast
Contact
Special Collections
Submit an Article
Online ISSN: 1945-4589
Research Paper
|
Volume 14, Issue 16
|
pp. 6796–6808
MiR-217-5p inhibits smog (PM2.5)-induced inflammation and oxidative stress response of mouse lung tissues and macrophages through targeting STAT1
Back to article
Figure 1
(1 of 7)
−
100%
+
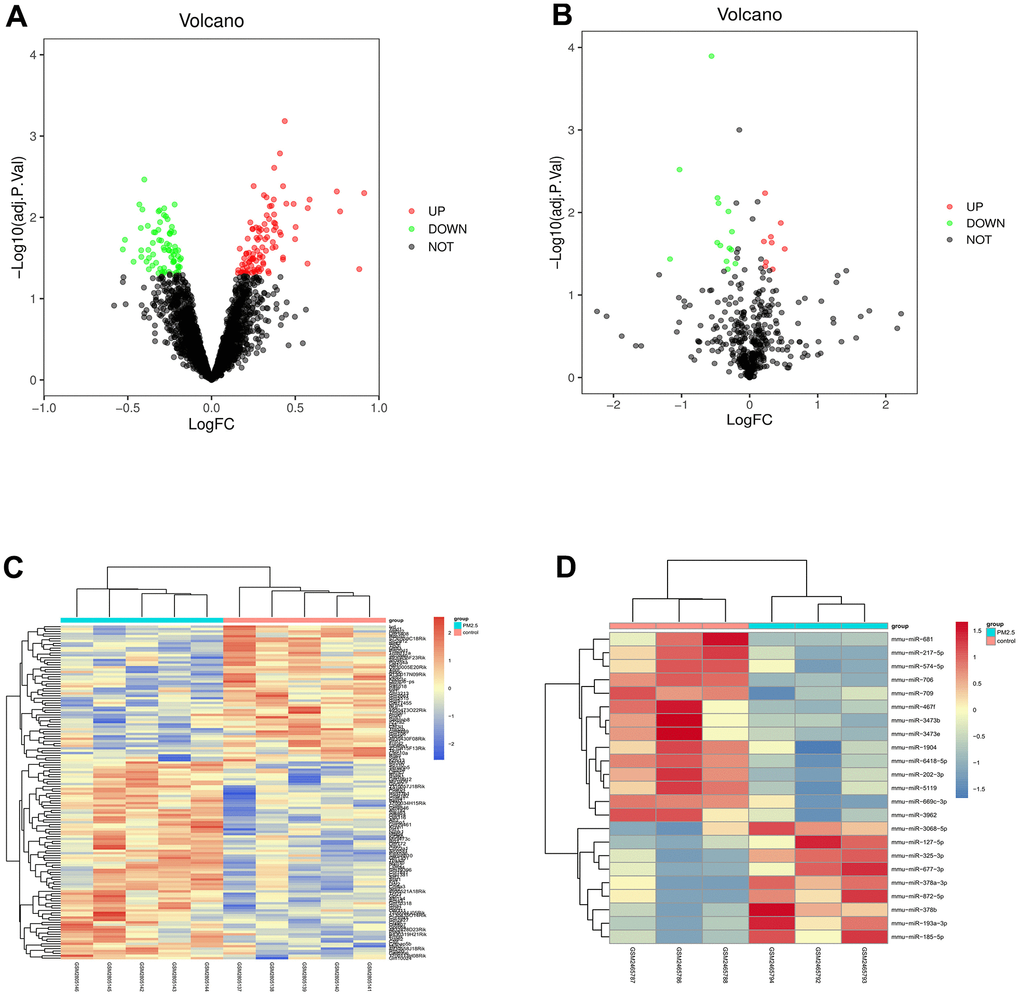
Figure 1.
Screening of differential gene (DEG).
(
A
,
B
) showed the volcano plot of visual grouping of DEGs in the dataset GSE104656 and GSE62819. (
C
,
D
) represented the cluster analysis heat map of DEGs in the dataset GSE104656 and GSE62819.