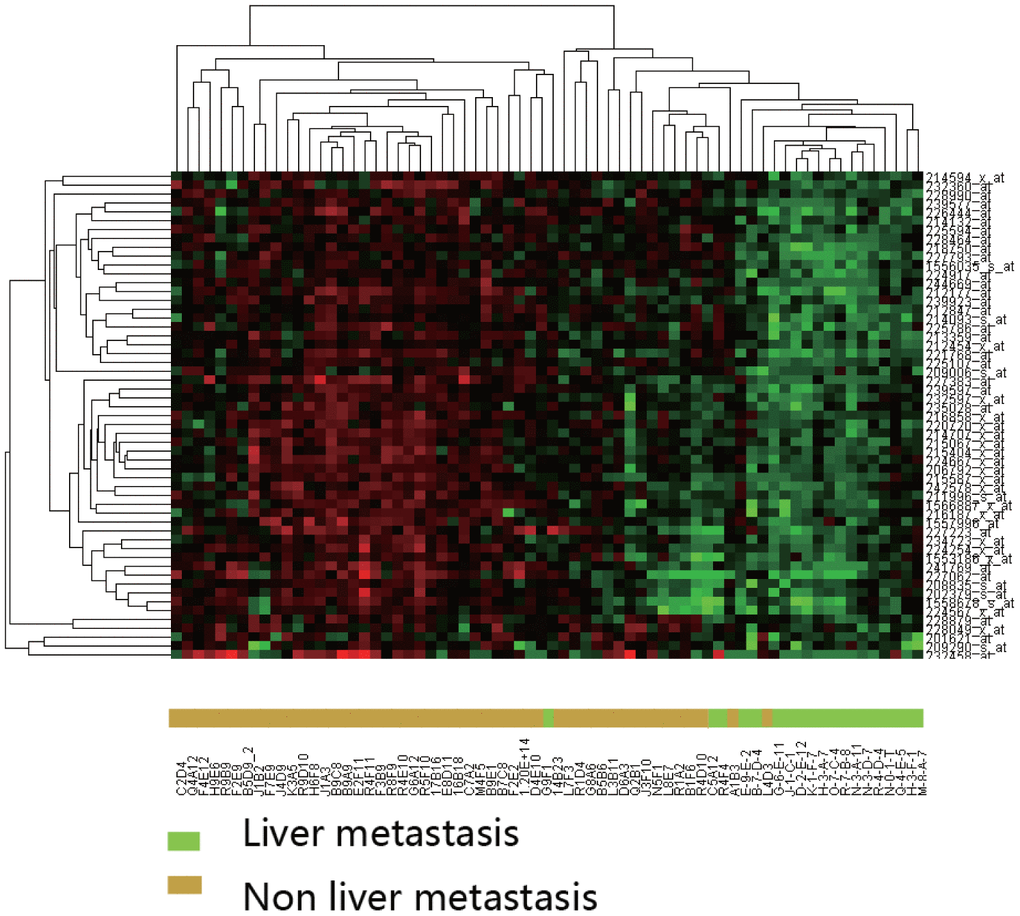
Figure 2.Hierarchical clustering analysis of differentially expressed genes between CRC with and without liver metastasis. Clustering was performed using the Pearson correlation with average linkages. Expression intensities are shown after gene and sample normalization.