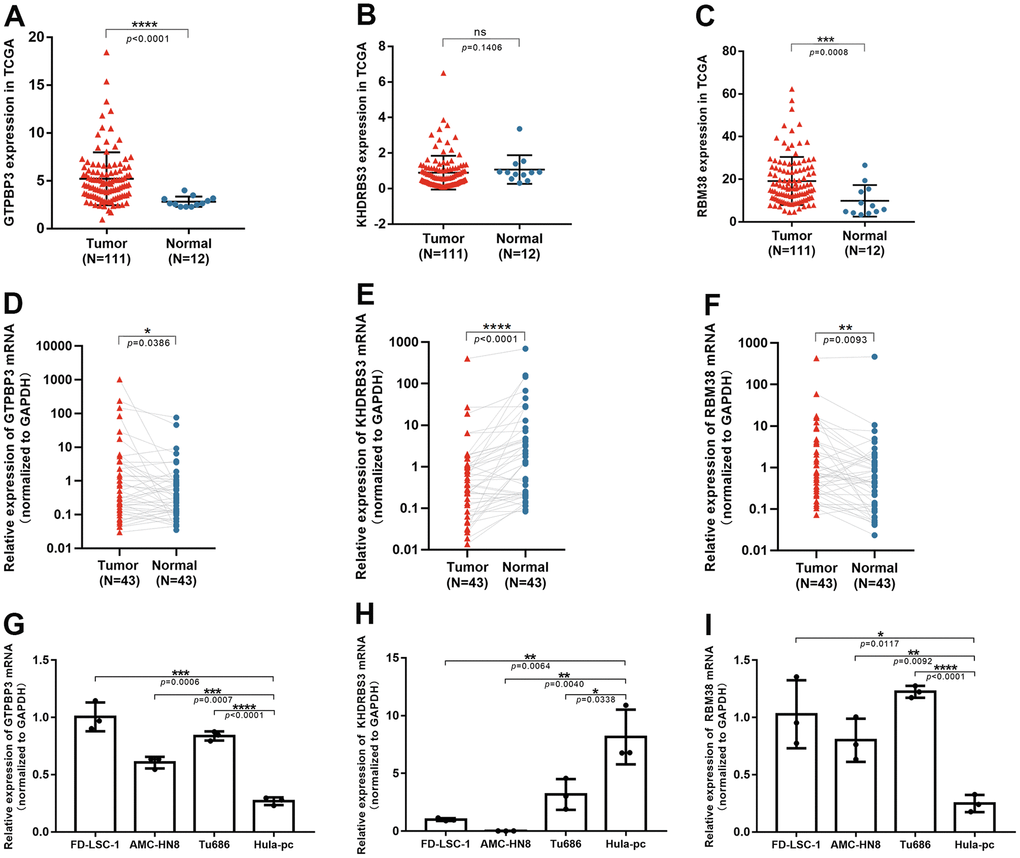
Figure 8.The validation of three RBPs in tissues and cell lines through qRT-PCR. (A–C) Expression of GTPBP3, KHDRBS3 and RBM38 in TCGA database; (D–F) GTPBP3 and RBM38 presented higher expression in LSCC, compared to their adjacent normal tissue, while KHDRBS3 was the opposite; (G–I) GTPBP3 and RBM38 presented higher expression in LSCC cell lines, compared to laryngeal epithelial cell line HuLa-PC, while KHDRBS3 was the opposite.