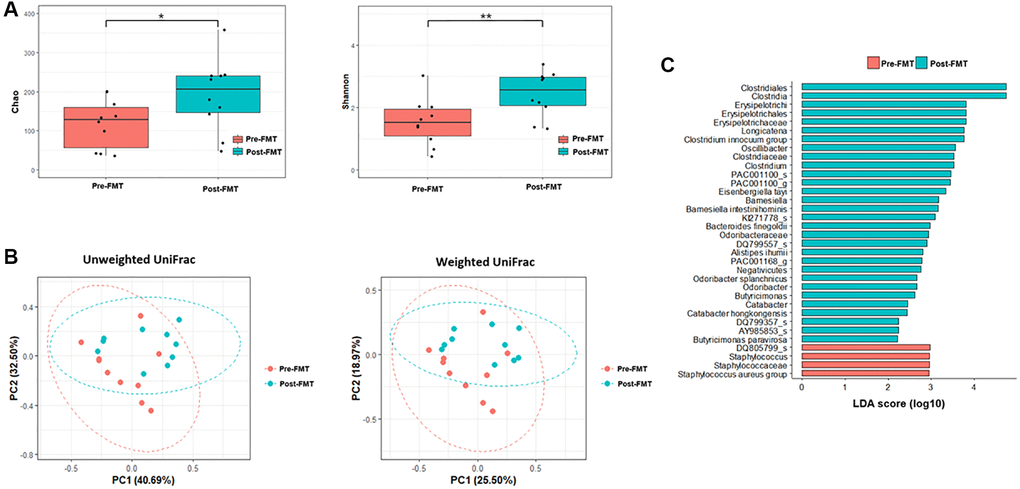
Figure 3.Microbiome analysis before and after fecal microbiota transplantation (FMT). (A) Alpha diversity was calculated using the number of overserved Chao and Shannon. (B) Principal coordinate analysis (PCoA) profile of microbial diversity across all samples using unweighted and weighted UniFrac. (C) Linear discriminant analysis effect size analysis (P < 0.05). *P > 0.05, **P < 0.05.