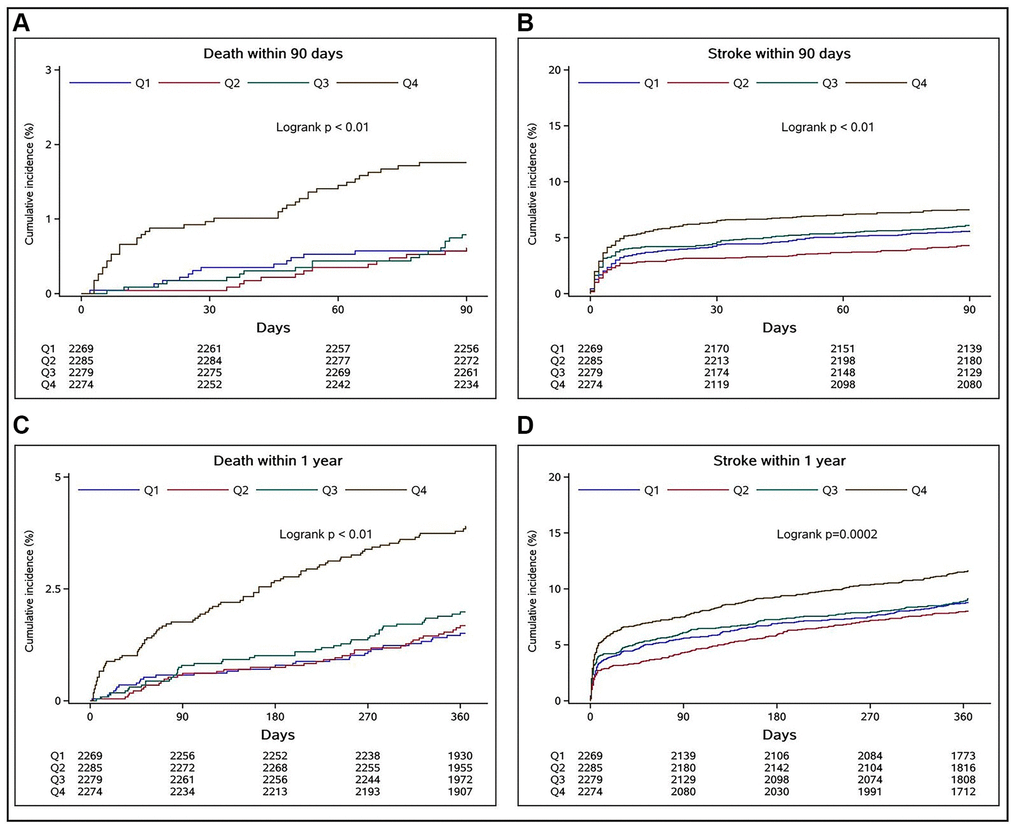
Figure 2.Relationships between SII quartiles and cumulative incidence rates of all-cause deaths and recurrent strokes in stroke patients at 90-day and 1-year follow-up assessments. (A and B) indicate the relationships of the SII quartiles with the cumulative incidence rates of all-cause death and recurrent stroke at the 90-day follow-up, respectively, whereas (C and D) show the respective outcomes at the 1-year follow-up.