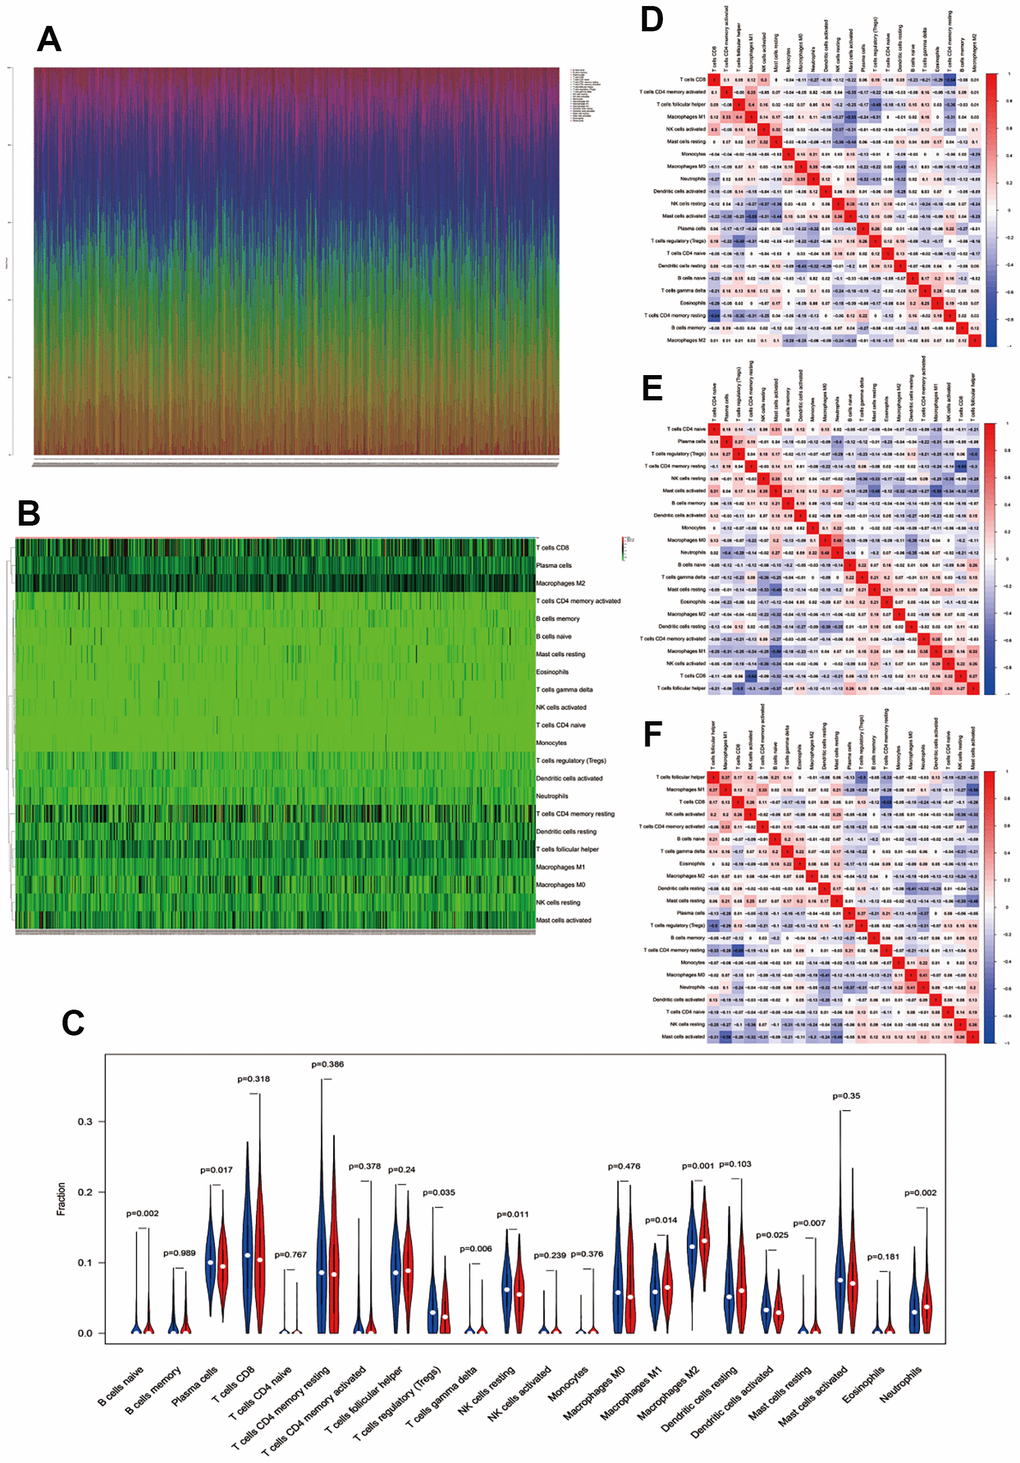
Figure 6.Immune infiltration between the low- and high-risk groups. (A) Fractions of immune cells in every single CC sample. (B, C) Heatmap and vioplot of immune cells between the low- and high-risk groups. Correlation between immune cells in low-risk samples (D), high-risk samples (E), and all colon cancer samples (F).