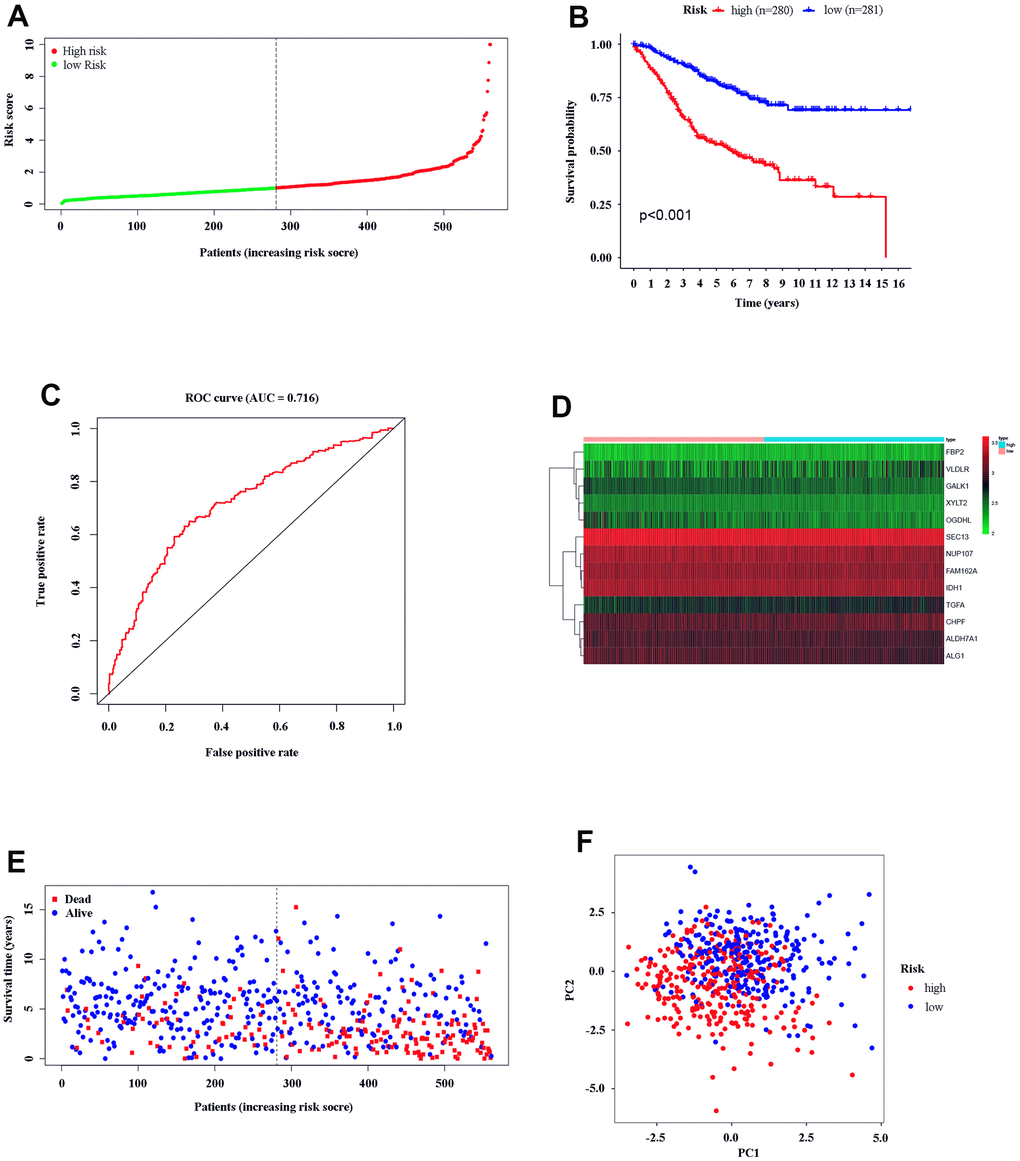
Figure 3.Text efficacy of the gene model in CC patients. (A) CC patient distribution according to the median risk score. (B) Kaplan–Meier analysis between the low- and high-risk groups. (C) ROC analysis of the risk score. (D) Model gene expression in the low- and high-risk groups. (E) The relationship between patient survival status and risk score. (F) PCA between the low- and high-risk groups.